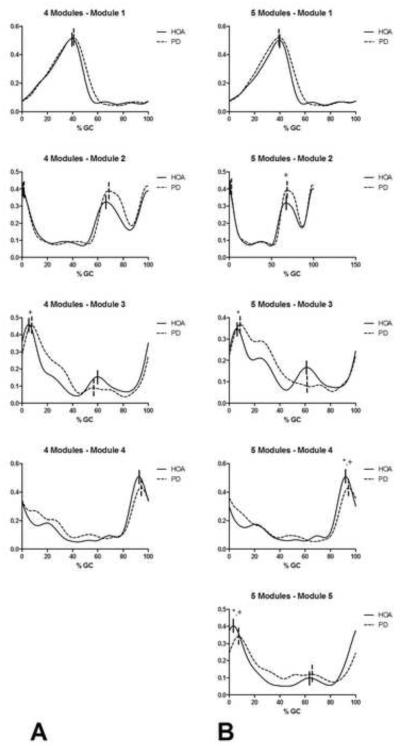
Figure 3.
Module activation profiles when 95% of variability was accounted for. Profiles in columns A and B correspond to those observed when four and five modules were assumed, respectively. The solid vertical lines indicate the peaks of the HOA profiles while the dashed vertical lines indicate the peaks of the PD profiles. *indicates a significant difference (p<.05) in the magnitude of the peaks while + indicates a significant difference (p<.05) in the timing of the peaks.

