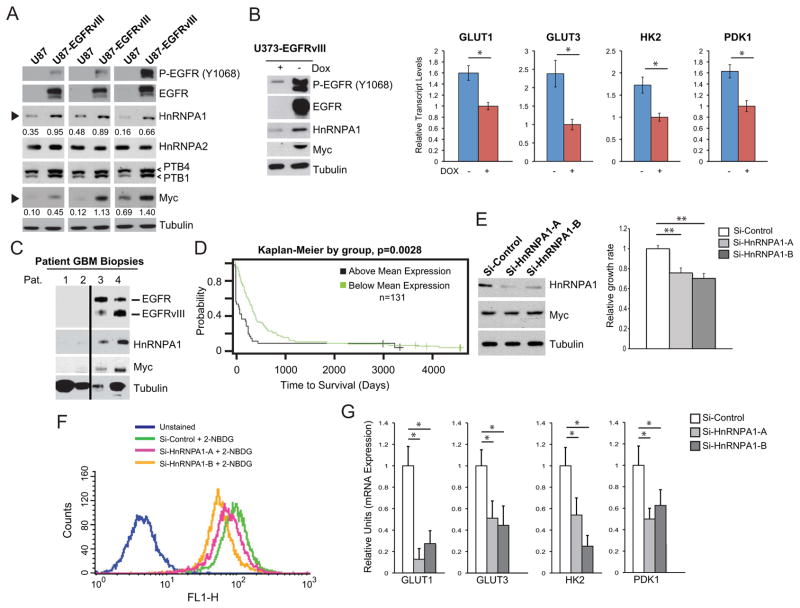
Figure 2. EGFRvIII regulates expression of Myc and hnRNPA1 splicing factor promoting glycolysis, proliferation and shorter patient survival.
(A) Immunoblot analysis of Myc and downstream splicing factors from three U87 xenograft tumor lysates and three U87-EGFRvIII xenograft tumor lysates. Numerical values below HnRNPA1 and Myc blots (black arrows) is densitometric quantification of bands normalized to tubulin.
(B) (Left) Immunoblot analysis of lysates from U373 with doxycycline-regulated EGFRvIII expression, and (right) relative mRNA transcript levels of GLUT1, GLUT3, HK2, and PDK1 upon acute loss of EGFRvIII (n=4; shown is the mean±SD; * p<0.05).
(C) Immunoblot analysis of patient GBM biopsy samples having low EGFR expression or EGFR amplification and EGFRvIII expression.
(D) Kaplan-Meier overall survival plots of 131 primary GBM patients stratified by survival plots for hnRNPA1 expression. The single p-value is based on the difference of the two curves, and was calculated using the log-rank test.
(E) Cell proliferation of U87-EGFRvIII cells with hnRNPA1 knockdown (n=3; shown is mean±SD; ** p<0.01).
(F) Uptake of fluorescein-conjugated glucose (2NBDG) after 1 hour in U87-EGFRvIII cells transfected with the indicated siRNA. Unstained are cells without 2NBDG.
(G) RT-qPCR analysis for glycolytic gene expression in U87-EGFRvIII cells with hnRNPA1 knockdowns (n=3; shown is mean±SD; * p<0.05).

