
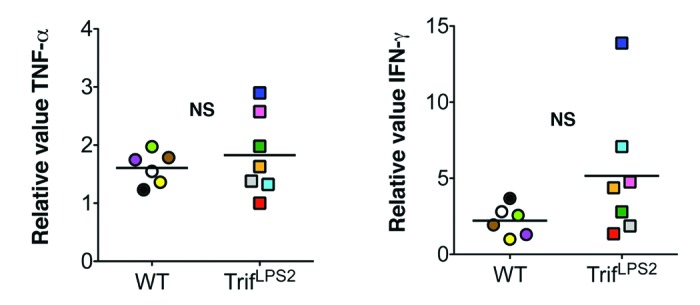
Figure 3. Splenic pro-inflammatory cytokine responses are similar between WT mice and TrifLPS2 mice after intravenous Y. enterocolitica infection. Left panel: Real-time PCR analysis of TNF-α mRNA expression in the spleen. Right panel: Real-time PCR analysis of IFN-γ mRNA expression in the spleen. TrifLPS2 mice n = 7, WT n = 6, p = 0.13, NS: not significant, error bars, s.e.m. Each color on graph indicates the value of individual mice.