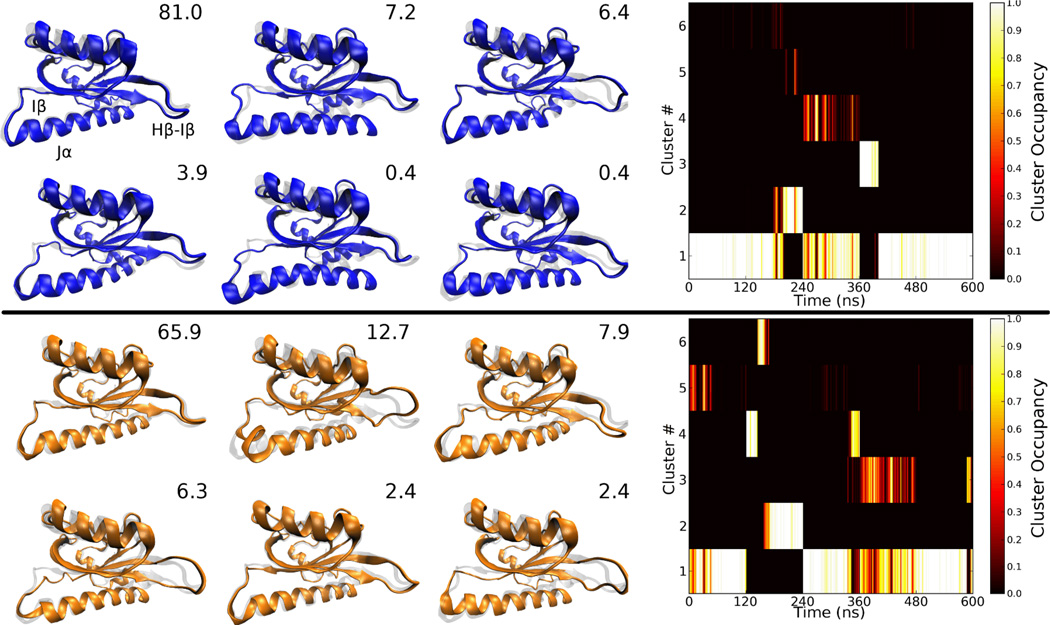
Figure 3.
Conformations of the first six clusters from clustering analysis on the dark (top) and light state equilibrium MD trajectories, with population in order of descending population. The dark state crystal structure of the appropriate state is shown in a grey transparent representation for reference. Inset numbers indicate the percentage of timesteps belonging to that cluster. To the right of the structures, the occupancy density of each cluster throughout each trajectory is shown (averaged over 2 ns windows). Results for the five trajectories for each state are concatenated for simplicity of display. Due to culling of the first 80 ns of each trajectory, the 600 ns time period shown corresponds to 5 × 120 ns since each trajectory contributes only 120 ns to the plot.

