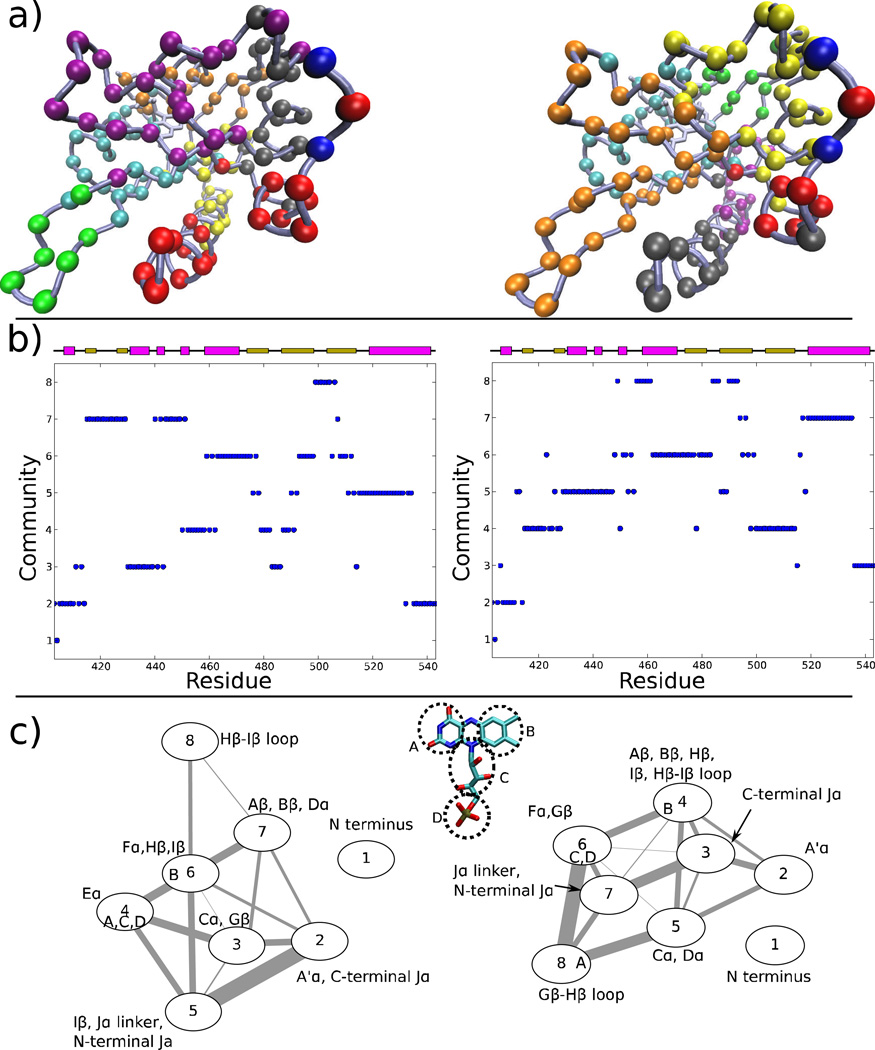
Figure 5.
Network analysis of correlated motions in the LOV domain. (a) Partition of residues from the dark (left) and light (right) states into communities; the communities are colored in numerical order: blue, red, gray, orange, yellow, tan, purple, green, white. (b) Community identity of each residue in the dark (left) and light states. (c) Interactions of communities in the dark (left) and light states; the width of each edge is proportional to the number of shortest paths passing through the interface of those communities (see Sethi et al. 54). Membership of nodes from the chromophore is indicated by letters within the circle for each node, based on the division shown in an inset.

