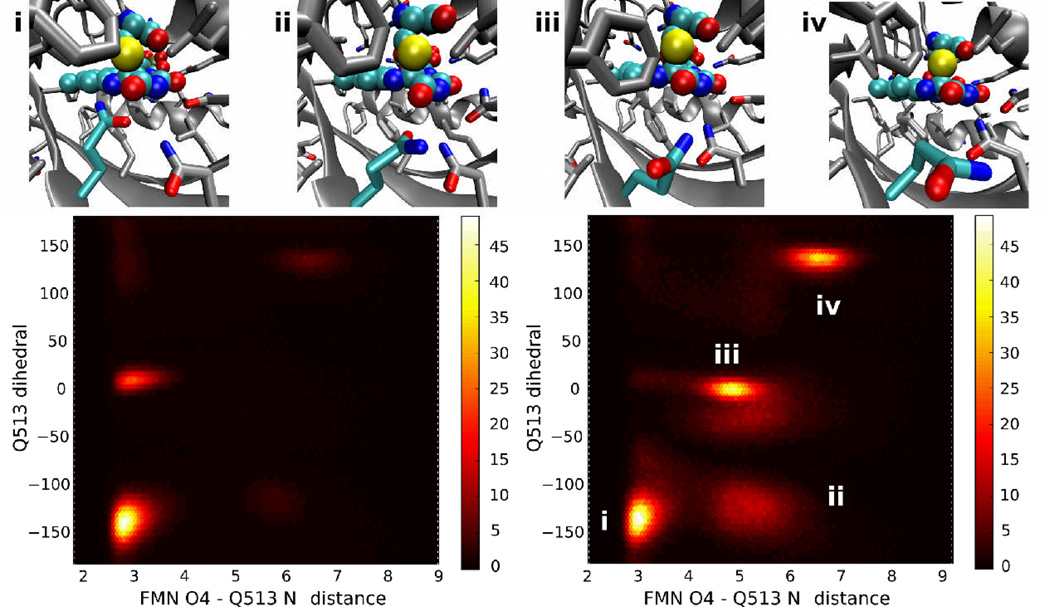
Figure 8.
Common conformations of Q513 observed during equilibrium trajectories. Along the top of the figure, representative structures from the four most common Q513 orientations are shown; the chromophore and Q513 are colored cyan. Below, density plots of the occupancy throughout all dark (left) or light (right) state trajectories for different values of the Q513 Nε-FMN O4 distance and the dihedral formed by the N, Cα, Cγ, and Cδ atoms of Q513 (Q513 dihedral); the color scale shows the number of snapshots in each bin, with snapshots taken at 2 ps intervals over the complete trajectories. The regions corresponding to the four snapshots are shown in the light state density plot.

