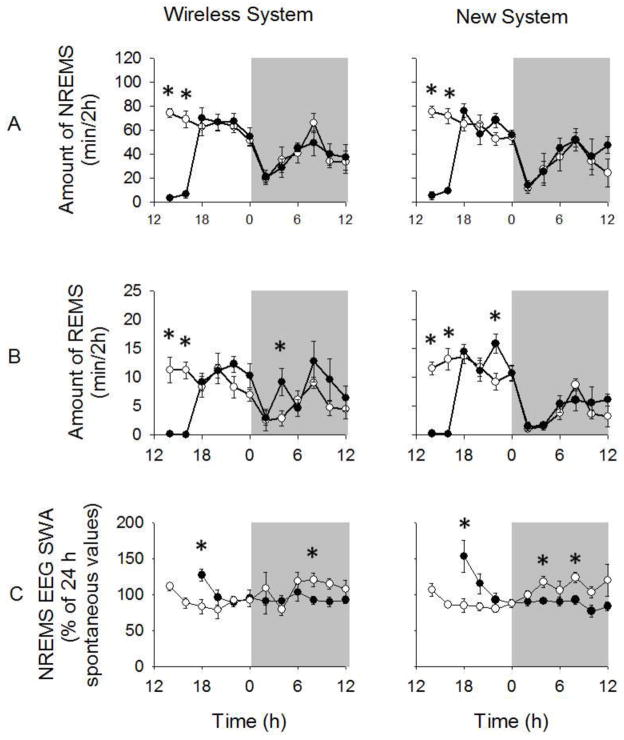
Fig 6.
NREMS and REMS duration and NREMS EEG SWA responses during spontaneous sleep and after sleep deprivation. (A and B) NREMS and REMS duration were reduced during the 4 h sleep deprivation procedures compared to spontaneous sleep responses for mice in both systems (p < 0.001). Mice in both systems exhibited NREMS and REMS durations after sleep deprivation that were largely similar to spontaneous values. (C) Enhanced NREMS EEG SWA during the first 2 h post-sleep deprivation and a negative rebound in NREMS EEG SWA were found compared to spontaneous sleep values for mice in both systems (p = 0.005 and p = 0.002, respectively). White background = light period; gray background = dark period. White circles = spontaneous sleep; black circles = responses during and after sleep deprivation. (*) = significant difference between spontaneous sleep and sleep responses after sleep deprivation. Significance was set at p < 0.05.

