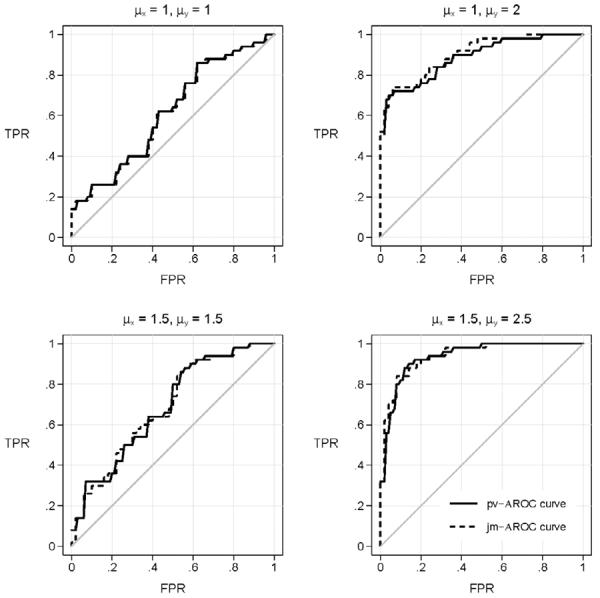
Figure 2.

ROC curves calculated on simulated data sets generated under four scenarios. Shown are the estimated covariate adjusted ROC curve, calculated with the covariate adjusted percentile-value method, pv-AROC, and with the joint risk model method, jm-AROC. The scenarios are the same as those shown in Figure 1 but with smaller sample sizes, 50 cases and 50 matched controls.
