
Figure 4.
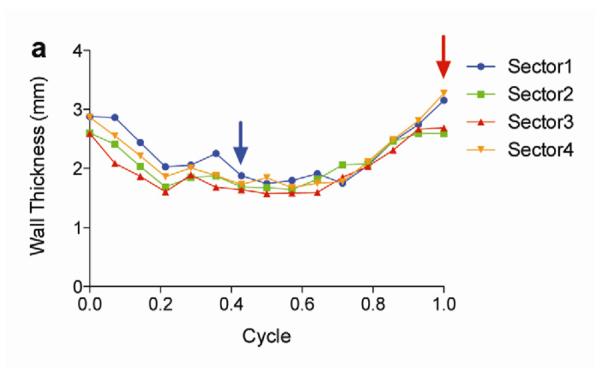
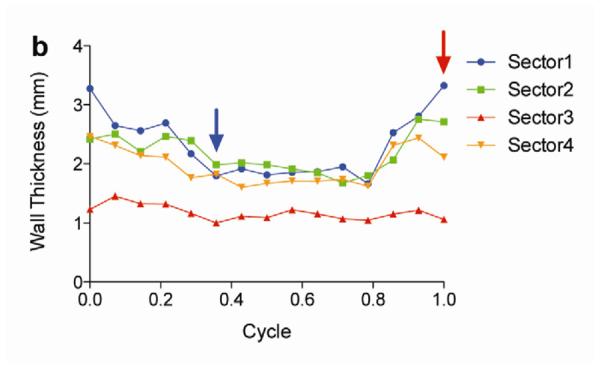
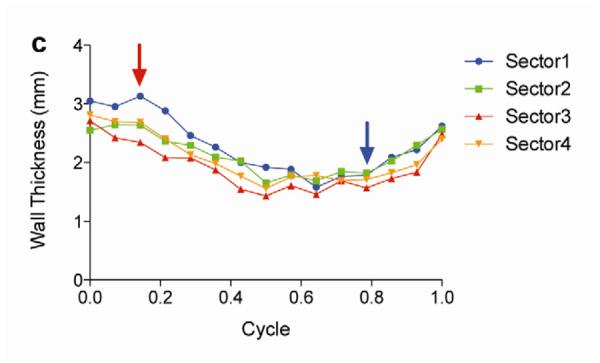
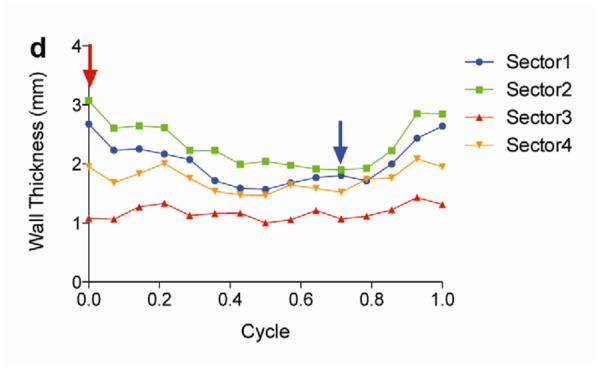
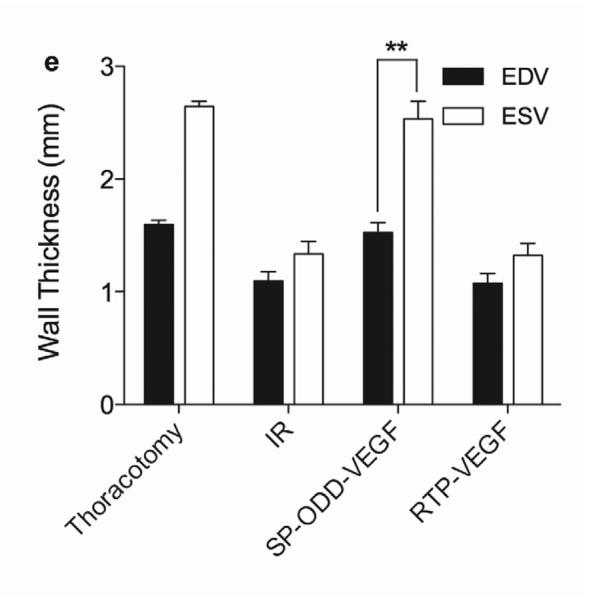
Analysis of left ventricular wall thickness. Changes in wall thickness over time were determined by MRI analysis of (a) thoracotomy only, (b) Ischemia/Reperfusion (I/R), (c) pβ-SP-ODD-VEGF treatment, and (d) RTP-VEGF treatment groups. The left ventricles were divided into four sectors. Sector 3 indicates the wall thickness of the infarct area. The red arrows and the blue arrows indicate end diastolic and end systolic wall thickness, respectively. (e) Wall thickness of infarct area at end diastole and systole was measured by MRI analysis two weeks after surgery. Data presented as the mean + SD (**p<0.01).