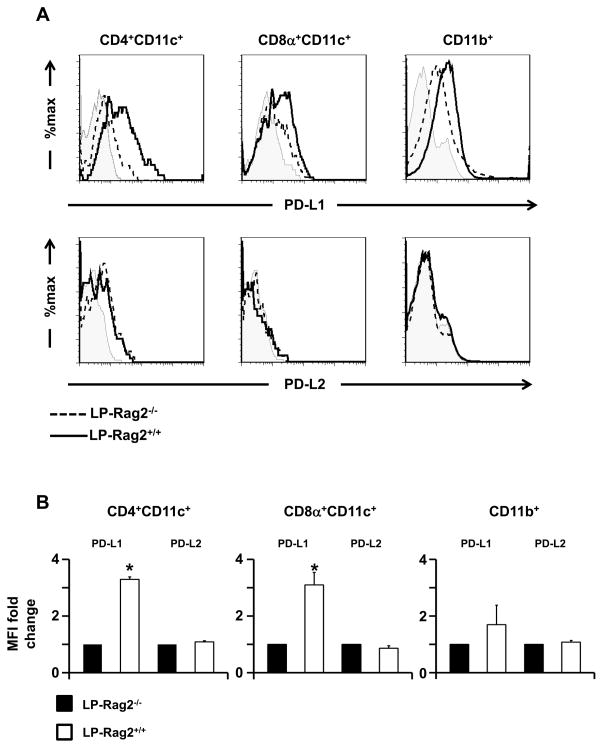
Figure 6. Exposure to oral Ig-MOG induces PD-L1 up-regulation on lamina propria DCs.
LP APCs were harvested from Rag2+/+ and Rag2−/ − C57BL/6 mice 24 h after oral administration of agg Ig-MOG + STI and expression of PD-L1 and PD-L2 was analyzed on specific subsets. (A) shows representative histograms of PD-L1 (top row) and PD-L2 (bottom row) expression on the indicated cell populations. Shaded histograms represent staining with matching isotype control. (B) shows the fold change in MFI for the indicated markers for LP DC subsets of Rag2+/+ relative to Rag2−/ − mice. This was determined by setting the MFI of LP DCs of Rag2−/ −mice to 1. Data is representative of at least three independent experiments. *p < 0.05 by one-sample t test.

