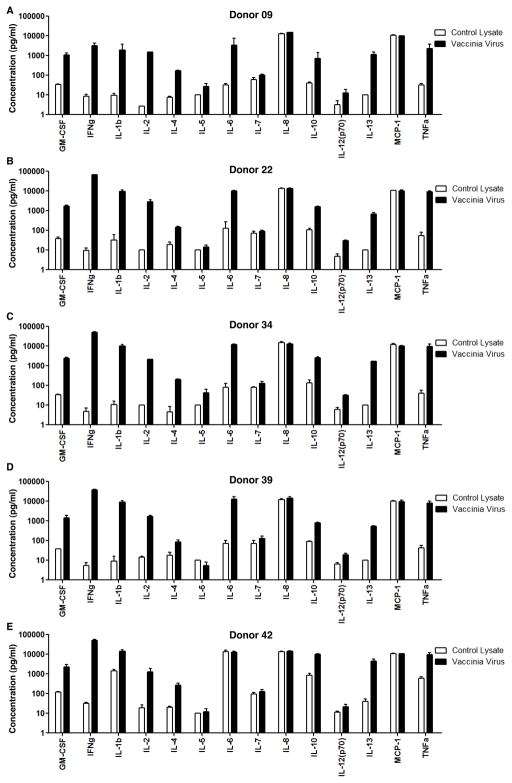
Figure 1. Human cytokine/chemokine production profile followed by Vaccinia virus-vaccination.
5×10⁵ PBMCs from donors 45 days after vaccination were stimulated with heat-inactivated vaccinia virus-infected CV-1 cell lysate (solid black bar) or control non-infected CV-1 cell lysate (open bar) for 48 hours. The supernatants were collected and the production of 14 cytokines/chemokines as listed on the figure was quantified by fluorescence intensity of antibody-immobilized beads as described in the methods for (A) donor 09, (B) donor 22, (C) donor 34, (D) donor 39, and (E) donor 42. Each cytokine/chemokine was distinguished by the different sizes of the corresponding antibody-immobilized beads, and the concentration was converted from fluorescence intensity using five-parameter logistic curve model (Bio-Rad, Hercules, CA). The concentrations for IFNg were out of the range of the standard curve in the Multiplex assay, which were then determined by ELISA. Each sample had three replicates.

