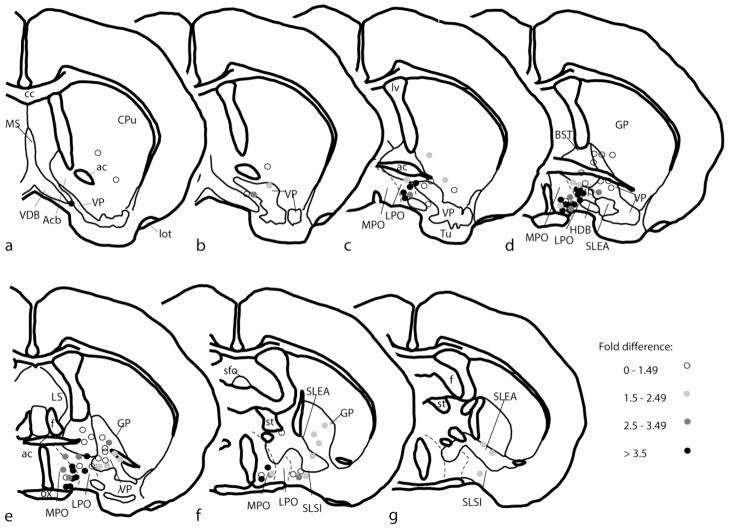
Figure 2.
A–G. Diagrams of a series of frontal sections ordered from rostral to caudal that were drawn on the basis of immunohistochemical observations as illustrated in Fig. 1. Round symbols indicate the positions of the tips of ejection cannulae from which bicuculline and saline were infused into the brain to generate data illustrated in Fig. 3 and Tables 2 and 3. The symbols are coded such that increasing density of gray tone indicates increasingly robust locomotor responses to infusion of bicuculline. Fold difference refers to the amount of distance traversed in an activity chamber according to the following relationship: [beam breaks/20 minutes following bicuculline infusion]/[beam breaks/20 minutes following saline infusion]. Structures and abbreviations are as provided in Fig. 1 legend.

