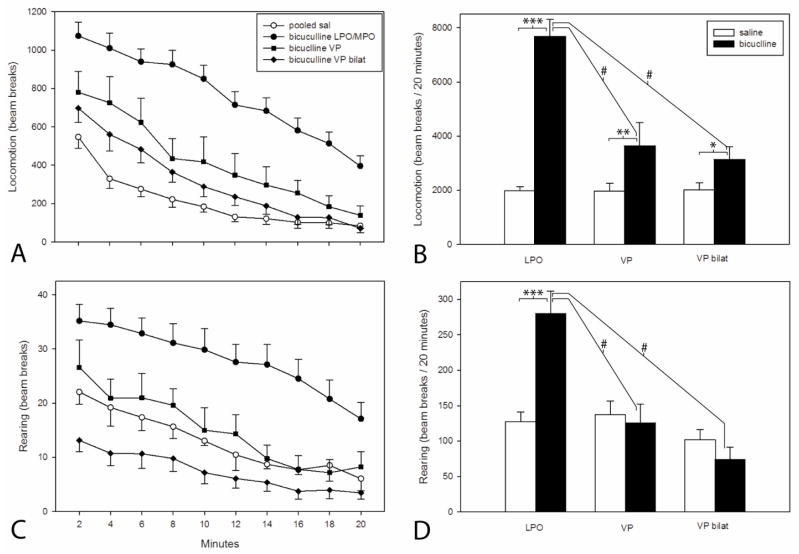
Figure 3.
A and C: Plots illustrating ambulatory locomotor activation following infusion of bicuculline hydrobromide (67 ng/0.25 μl) into the lateral preoptic area (LPO), ventral pallidum unilaterally (VP) and bilaterally (VP bilat) and an equivalent volume of saline into the same structures. In the absence of differences between groups, the data for saline infusions into LPO, VP and VP bilat were pooled. After the infusions, the cannulae were left in place for one minute and then the rats were placed immediately into the activity monitors. Bins are 2 min in duration. B and D: Bar graphs reflecting total locomotion reflected in the respective adjacent line/scatter graphs (A and C). Pairs of bars were tested with paired t-tests and the bicuculline infusions were tested with a Kruskal-Wallis one-way ANOVA on ranks with post hoc comparisons by Dunn’s test. Paired t-test: *** P=<0.001, ** P=0.025, * P=0.017. Kruskal Wallis test with Dunn’s post hoc comparison: # P=<0.001.

