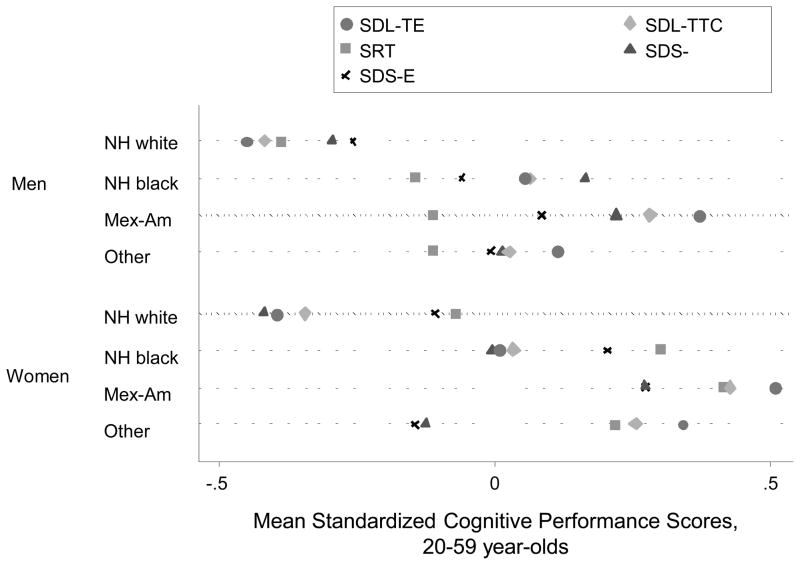
Figure 3. Dot plot for means of standardized cognitive performance scores in the younger age group (20–59yo) by sex and race; NHANES III phase 1 (1988–1991).
Abbreviations: ANOVA=Analysis of Variance; NH=Non-Hispanic; NHANES=National Health and Nutrition Examination Surveys; SDL-TTC=Serial Digits Learning-Trials to completion; SDL-TE=Serial Digits Learning-Total Errors; SDS-E=Symbol Digits Substitution tests-Errors; SDS-L=Symbol Digits Substitution tests-Latencies; SRT=Simple reaction time.
Notes: One-way ANOVA test indicated that there were significant differences in the standardized cognitive performance scores administered to the younger age groups by sex-race categories (p<0.001). Bonferroni-corrected multiple comparisons showed that differences within each sex were consistently significant between NH whites and the other race groups, indicating poorer performance in the other race groups among both men and women (p<0.001).

