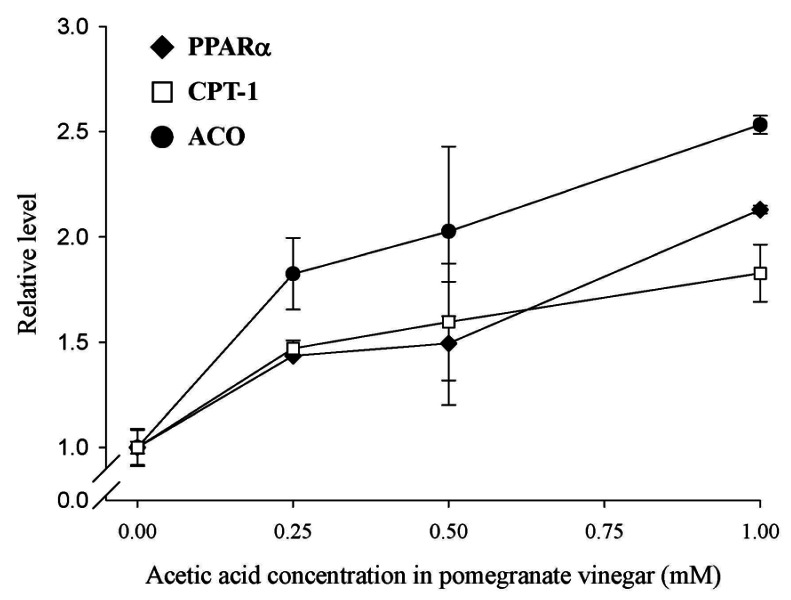
Fig. 3.
Dose-dependency of PV on the mRNA levels of PPARα (◆), CPT-1 (□), and ACO (●) in HepG2 cells. PV containing 0.25 to 1 mM acetic acid was applied to HepG2 cells, and the cells were incubated for 3 h. The mRNA levels were measured by RT-PCR and normalized to β-actin. Data shown (mean ± SD, n = 3) are typical of three experiments with similar results.

