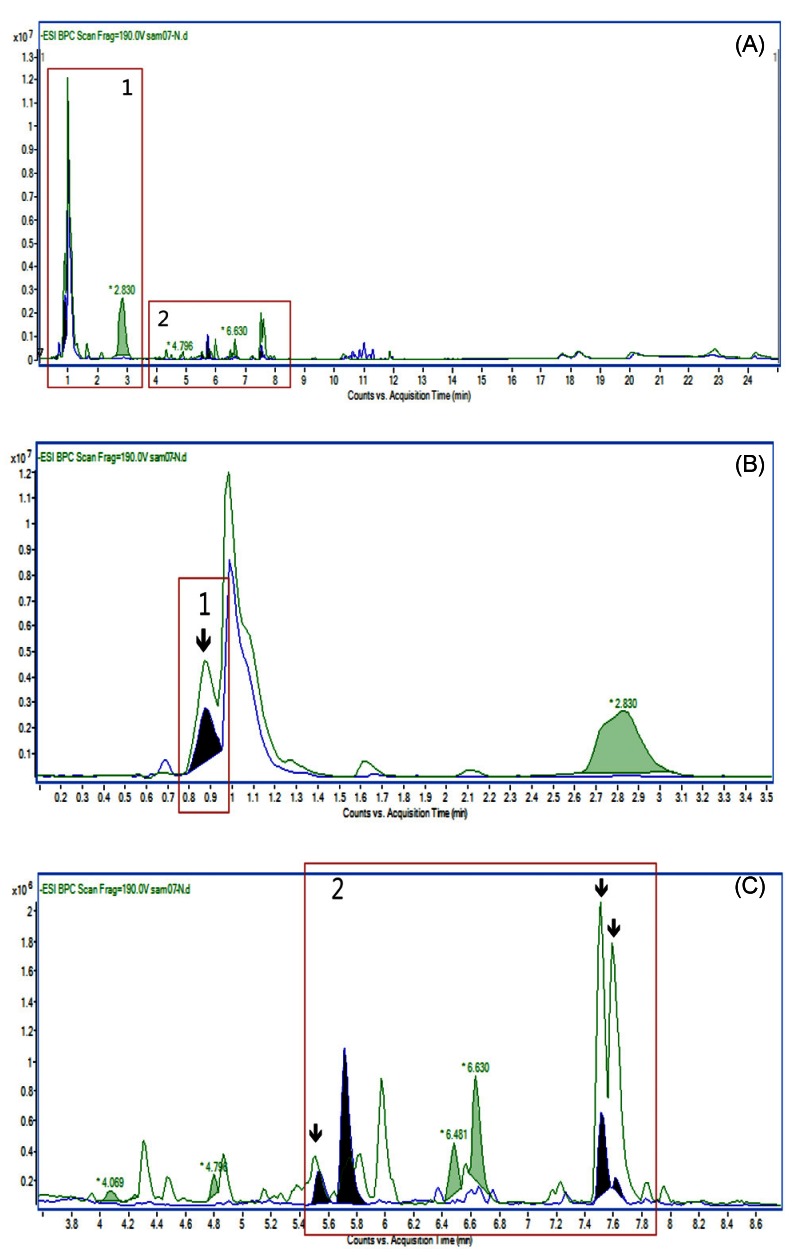
Fig. 6.
Comparisons of HPLC chromatograms for PV (Black filled) and pomegranate extract (Shaded). (A) shows the overlaid chromatogram of PV and pomegranate extract. HPLC chromatogram magnifications of panel 1 (B) and panel 2 (C) clearly show PV-specific peaks as indicated by down arrow in the chromatogram. Panel 1 shows the compound detected at 0.869 min and panel 2 shows punicalagin, the compound detected at 7.509 and ellagic acid, respectively.

