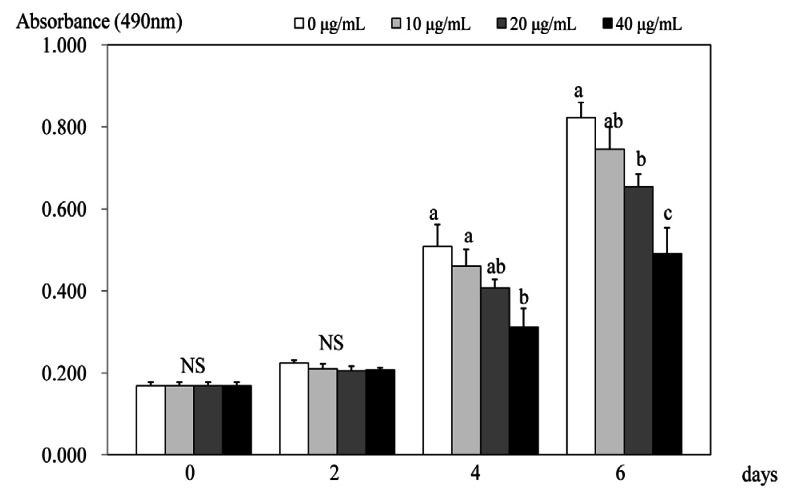
Fig. 1.
Effect of PSEE on cell growth in 3T3-L1 cells. 3T3-L1 cells were plated at a density of 1.5 × 10⁴ cells/mL in 24 well plate with DMEM, supplemented with 10% FBS, 10 µg/mL insulin, 1 µmol/L Dex, and 0.5 mmol/L IBMX for 2 days. After differentiation induction, the monolayer was incubated in post-differentiation medium with 0, 10, 20, or 40 µg/mL PSEE. Viable cell numbers were estimated by the MTT assay. Each bar represents the mean ± SE. Comparison among different concentrations of PSEE that yielded significant differences (P < 0.05) are indicated by different letters above each bar.

