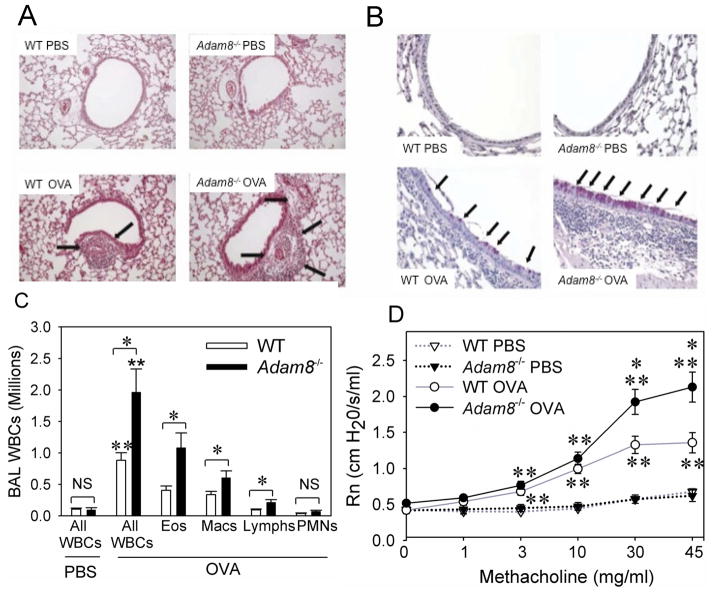
Fig. 1. Adam8−/− mice have greater OVA-induced AAI than WT mice.
In A–D, BALB/c WT and BALB/c Adam8−/− mice were sham sensitized with PBS or sensitized with a low of dose (10 μg) of OVA along with alum via the i.p. route and then challenged with aerosolized PBS or OVA. In A and B, lungs were inflated and fixed in formalin 24 h after the last PBS or OVA challenge and stained with hematoxylin and eosin (in A, original magnification × 100) or Periodic Acid Schiff (in B, original magnification × 400). The lung sections shown are representative of 6 mice per group. Arrows indicate peri-bronchial and peri-vascular inflammation in A and mucus metaplasia in B. In C, BAL was performed 24 h after the last PBS or OVA challenge and absolute numbers of all BAL leukocytes (All WBCs), eosinophils (Eos), macrophages (Macs), lymphocytes (Lymphs), and PMNs were counted. Data are mean ± SEM; n = 4 mice in the PBS-treated groups and 14–19 mice in the OVA-treated groups; * indicates p ≤ 0.001, and ** p ≤ 0.017 compared with PBS-treated mice belonging to the same genotype. In D, central airway resistance (Rn) to aerosolized methacholine was measured 24 h after the last PBS or OVA challenge. Data are mean ± SEM; n = 5–6 mice/group for PBS-treated mice and n= 14–20 mice/group for OVA-treated mice. Asterisk indicates p ≤ 0.014 vs. OVA-treated WT mice, and ** p 0.021 when compared with PBS-treated mice belonging to the same genotype as the OVA-treated mice. Responses for OVA-treated WT mice ranged from 0.5–1.6 cm H2O/s/ml for 10 mg/ml of methacholine; 0.6–1.9 cm H2O/s/ml for 30 mg/ml of methacholine; and 1.0–1.8 cm H2O/s/ml for 45 mg/ml of methacholine. Responses for OVA treated Adam8−/− mice ranged from 0.7–1.7 cm H2O/s/ml (for 10 mg/ml of methacholine); 1.1–3.4 cm H2O/s/ml (for 30 mg/ml of methacholine); and 1.5–3.4 cm H2O/s/ml (for 45 mg/ml of methacholine).

