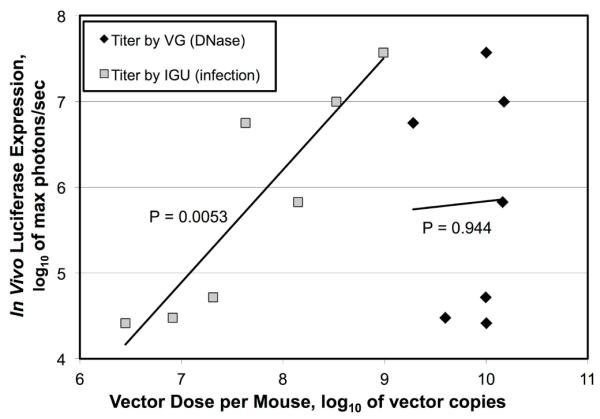
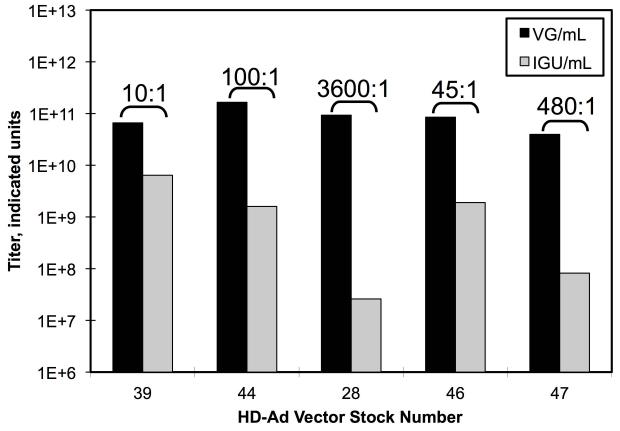
Figure 5. Relationship of Q-PCR Titers to Biological Activity.

(A) Five different stocks of luciferase expressing HD-Ad vectors were titered by Q-PCR using two different protocols; one including an infection step (IGU/mL) and one that included only a DNase I treatment (VG/mL). Brackets indicate the ratio of VG to IGU. (B) In a series of in vivo experiments, each stock was injected into mice and assayed by bioluminescent imaging. This figure plots the log of the maximum level of luciferase expression against the log of the dose injected as determined by each titration method. Each set of seven data points was used to calculate a curve and to calculate a correlation coefficient. The correlation coefficient was used to calculate two-tailed P-values with five degrees of freedom.

