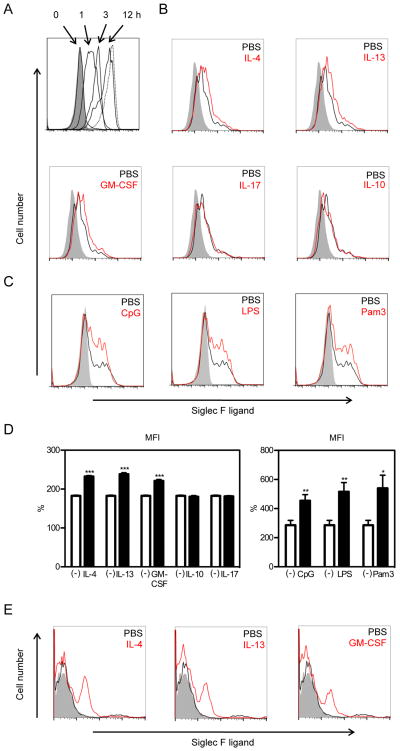
FIGURE 2. Siglec-F ligand expression on MLE-12 cells is upregulated by IL-4, IL-13, GM-CSF, and TLR ligands.
A. The expression of Siglec-F ligands on cell surface of MLE-12 cells at indicated times after sialidase treatment was analyzed by flow cytometry. Shaded area shows the staining with control human IgG and dotted lines show the staining on MLE-12 without sialidase pretreatment. Data are representatives from three separate experiments showing similar results. B, C. 24 hours after sialidase treatment, MLE-12 were stimulated with indicated cytokines or TLR ligands for 6 hours and analyzed for Siglec-F ligand expression. Shaded area show the staining with control human IgG, black lines show the staining on cells without stimulation, and red lines show the staining on cells after stimulation. Data are representatives from three separate experiments showing similar results. D. Quantitation of MFI of Siglec-F ligand expression in MLE-12 cells incubated either without stimulus [depicted as (-) symbol], or incubated with individual cytokines (IL-4, IL-13, GM-CSF, IL-10, IL-17) or TLR ligands (CpG, LPS, Pam3). Specific MFI calculated as % of FL2 MFI compared to control stain. Results expressed as mean ± SEM. *p<0.05, **p<0.01, and ***P<0.001 vs unstimulated (n=6). E. 24 hours after sialidase treatment, primary lung epithelial cells were stimulated with indicated cytokines for 6 hours and analyzed for Siglec-F ligand expression. Shaded area shows the staining with control human IgG, black lines show the staining on cells without stimulation, and red lines show the staining on cells after stimulation. Data are representatives from three separate experiments showing similar results.

