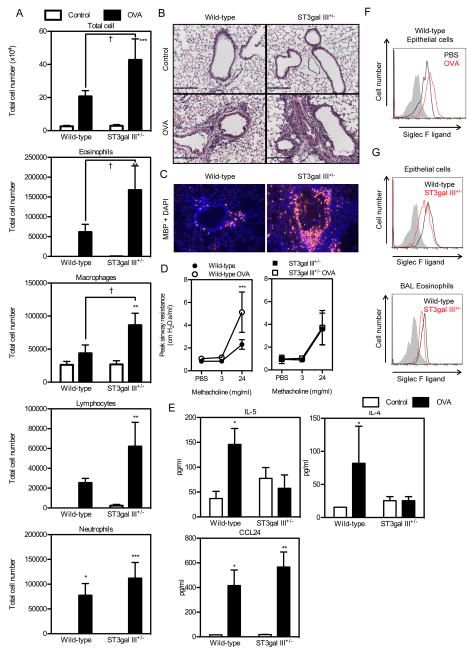
FIGURE 4. OVA- induced eosinophilic lung inflammation is exaggerated in ST3gal III+/− mice.
A. The numbers of BAL cells in WT mice (PBS, n = 4; OVA, n =6) and ST3Gal-III+/− mice (PBS, n = 8; OVA, n = 7) immunized i.p. with OVA with alum and sacrificed at 24 hours after the last challenge are shown. Data show the mean ± SEM. *p < 0.05, **p < 0.01, and ***p < 0.001 versus the corresponding values for control mice, and †p < 0.05 versus the indicated group. B. Hematoxylin-eosin staining of the lung sections from WT mice and ST3Gal-III+/− mice. C. MBP staining with DAPI staining of the lung sections from WT mice and ST3Gal-III+/− mice. Representative data for the mice used in (A) are shown. Scale bars = 100 μm. D. Airway responsiveness to methacholine was measured in non-OVA and OVA challenged WT mice (no OVA, n=4; OVA n=7) and ST3Gal-III+/− mice (no OVA, n=3; OVA, n=6). **p<0.01 WT OVA vs WT no OVA, p< 0.05 WT OVA vs ST3Gal-III+/− OVA. E. Levels of BAL IL-5, IL-4, and CCL24 from WT mice (PBS, n = 8; OVA, n =16) and ST3Gal-III+/− mice (PBS, n = 11; OVA, n = 14) are shown. *p < 0.05, ** p<0.01 vs control PBS group. F. Siglec F ligand expression on lung epithelial cells from WT mice are shown. Shaded area show the staining with control human IgG, black lines show the staining on cells from control mice and red lines show the staining on cells from OVA-treated mice. Data are representatives from four separate mice showing similar results. G. Siglec F ligand expression on lung epithelial cells and BAL eosinophils are shown. Shaded area show the staining with control human IgG, black lines show the staining on cells from OVA-treated WT mice and red lines show the staining on OVA-treated ST3Gal-III+/− mice. Data are representatives from four separate mice showing similar results.

