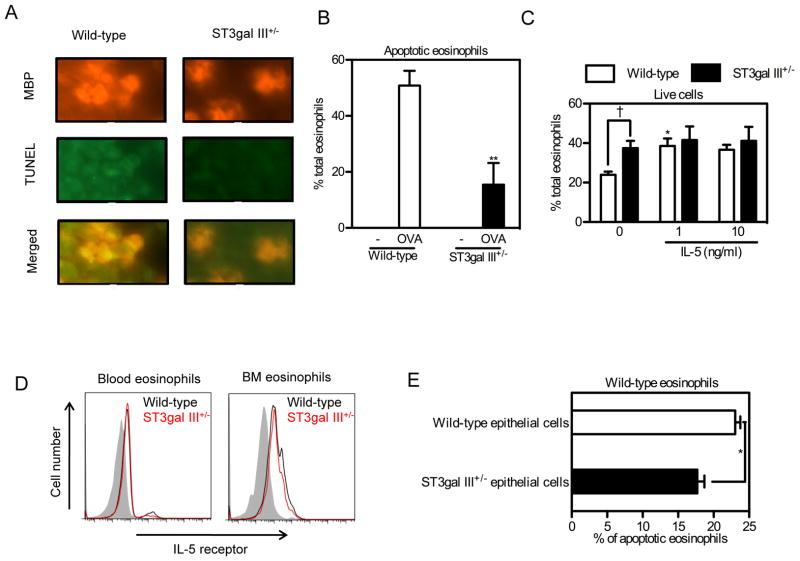
FIGURE 5. ST3Gal-III+/− eosinophils showed less apoptosis compared to WT eosinophils.
A. Lungs from OVA sensitized and challenged mice were stained using anti-mouse MBP antibody followed by TUNEL staining. Representative data for the mice used in Fig. 4A are shown. B. Apoptotic eosinophils in (A) are quantitated and shown as percentages of total eosinophils. **p < 0.01 versus WT OVA group. C. Peripheral blood cells from WT and ST3Gal-III+/− mice were incubated for 24 hours with indicated concentrations of rmIL-5 followed by FACS analysis for live eosinophils (n = 4). Eosinophils stained for Annexin V-negative and PI-negative cells were counted as live eosinophils and the percentages of live eosinophils are shown. Data show the mean + SEM. *p < 0.05 versus the control eosinophils without rmIL-5, and †p < 0.05 versus the indicated group. D. IL-5 receptor expression on blood and bone marrow eosinophils are shown. Shaded area show the staining with control stain, black lines show the staining on cells from WT mice and red lines show the staining on cells from ST3Gal-III+/− mice. Data are representatives from three separate experiments showing similar results. E, WT blood cells were co-cultured with primary mouse epithelial cells isolated and cultured from WT or ST3Gal-III+/− mice. 24 hours later, cells were collected and stained to detect live eosinophils and apoptotic eosinophils as described above. Data show the mean ± SEM (n = 3). *p < 0.05.

