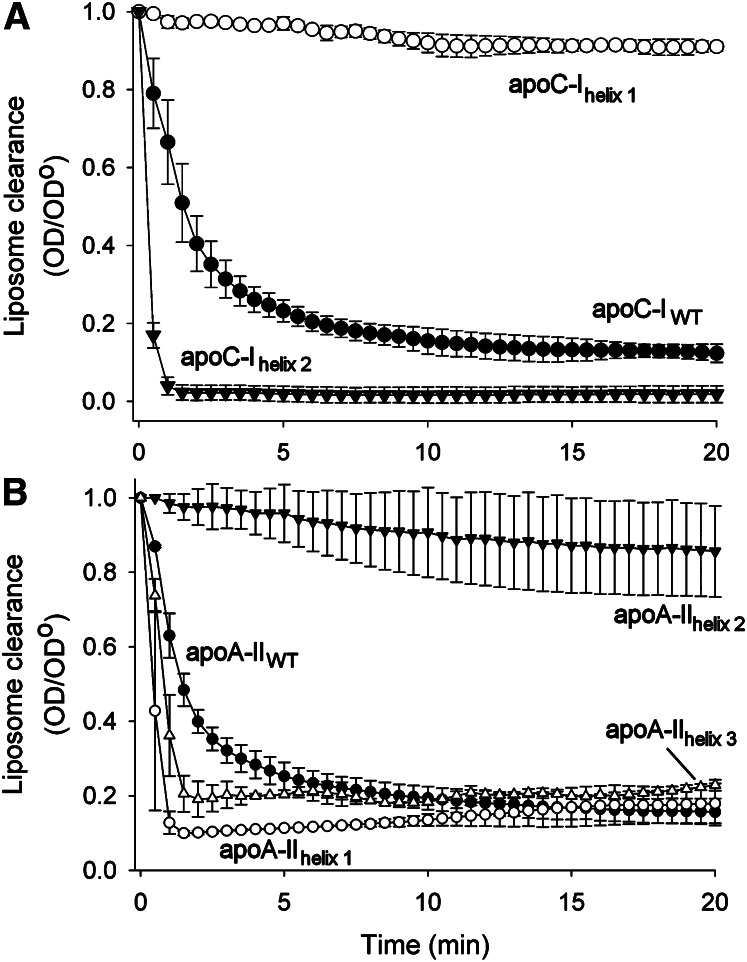
Fig. 4.
Ability of individual helices within apoC-I and apoA-II to clear DMPC liposomes. (A) Peptides modeling the individual α-helices of apoC-I were added to DMPC liposomes at a 23 mol lipid:1 mol α-helix ratio. The solution's turbidity over time is plotted. Conditions and data treatment were as indicated in Fig. 1. (B) Peptides modeling the individual α-helices of apoA-II were added to DMPC liposomes at a 10 mol lipid:1 mol α-helix ratio. Conditions and data treatment were as indicated in Fig. 1. All points are the means of three replicates, and bars represent mean ± 1 sample SD.

