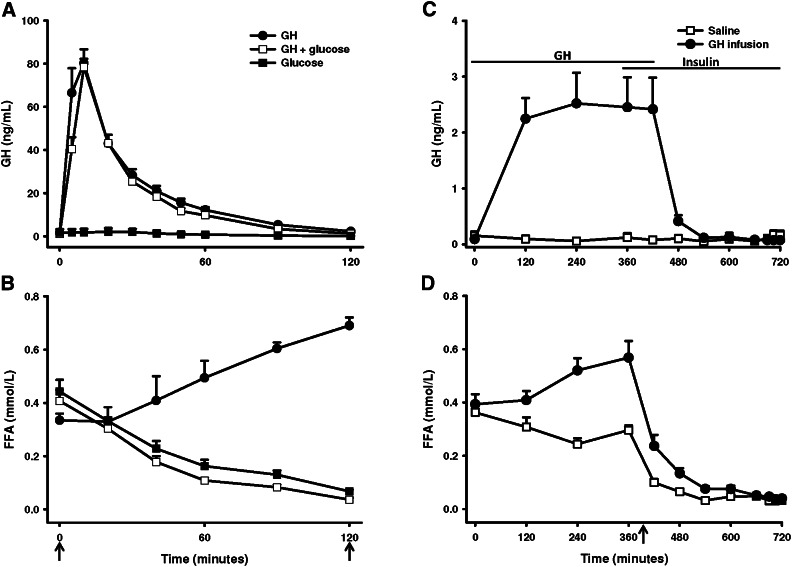
Fig. 1.
Circulating GH and FFA. (A) Serum GH and (B) serum FFA in group 1 after GH, OGTT, or GH+OGTT. GH and/or glucose was initiated at t = 0. (C) Serum GH and (D) serum FFA in group 2 after saline or GH infusion and hyperinsulinemic euglycemic clamp. Arrows indicate time of biopsy. Data are presented as means ± SE.

