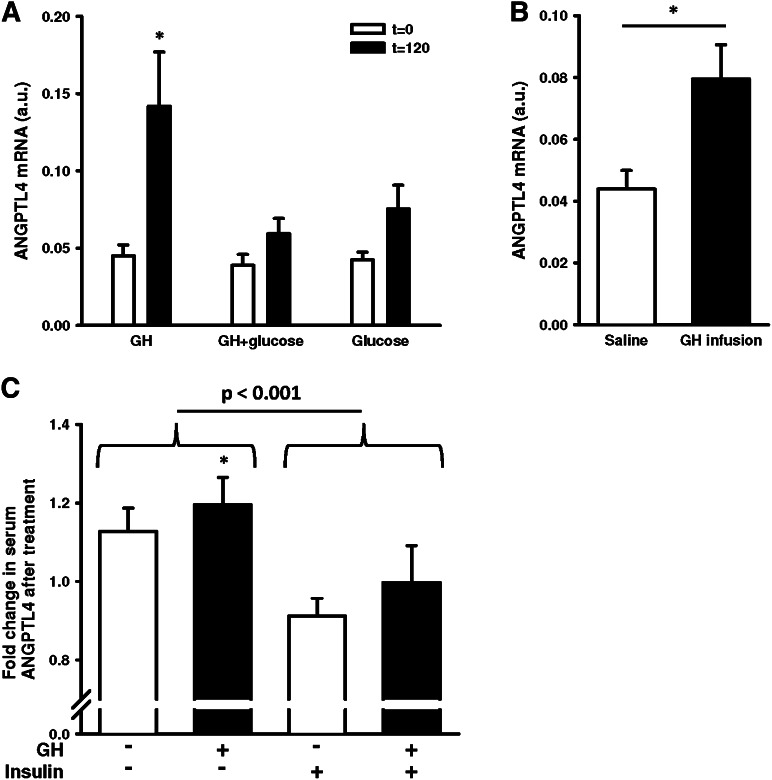
Fig. 5.
ANGPTL4 expression. (A) ANGPTL4 mRNA in skeletal muscle from healthy men, before and 120 min after GH, OGTT, and GH/OGTT. (B) ANGPTL4 mRNA in skeletal muscle from GHD patients under a 6 h saline or GH infusion. (C) Fold changes in circulating ANGPTL4 in GHD patients measured by ELISA. Fold changes calculated as ANGPTL4 protein levels after indicated treatment relative to the protein levels before treatment. GH: 6 h infusion; saline: 6 h infusion; insulin: 6 h hyperinsulinemic-euglycemic clamp. Data presented as means ± SE. Statistics by paired t-test and two-way repeated measurements ANOVA, *P ≤ 0.05.

