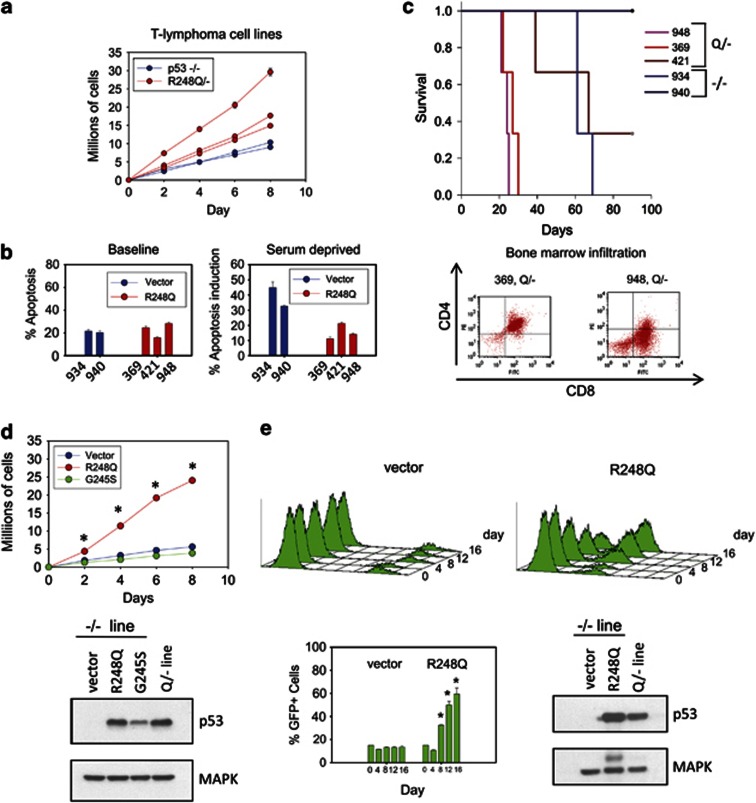
Figure 7.
Cell lines derived from R248Q/− lymphomas confirm GOF activities in vitro and in vivo. (a) Cell lines derived from R248Q/− and p53-null T lymphomas were serially passaged every 2 days at a density of 5 × 10⁵ cells per ml. The cumulative number of cells were graphed. The mean±S.E. of three repeats per cell line is shown. (b) Baseline apoptosis under normal growth conditions and the apoptotic response after 24 h of serum starvation in cell lines from (a). Cell line identities are indicated. Bars represent mean±S.E. for three replicate experiments per line. (c, top) Allograft transplantations of cell lines from (a). Cells (1 × 10⁵) were injected into the tail vein of nude mice; mice were killed when moribund. Each curve represents three injections per cell line. (c, bottom) Bone marrow of nude mice was harvested at the time of death and analyzed for the presence of infiltrating leukemic cells identified by CD4+CD8+. (d, left) HUPKI mutp53 R248Q or G245S or empty vector was retrovirally introduced into a p53-null T-lymphoma line (934). Cells were plated in triplicate at a density of 5 × 10⁵ cells. The total cell number was quantified every second day. The average±S.E. of three independent experiments is shown. *P<0.05. (d, bottom) Immunoblot confirming comparable levels of ectopic mutp53 compared with the endogenous mutant p53 present in a Q/− lymphoma line (948). (e) p53-null T-lymphoma cells expressing HUPKI mutp53 R248Q protein outcompete vector control cells in co-culture. (e, top) p53-null lymphoma line (934) expressing retroviral vector-IRES-GFP or R248Q-IRES-GFP were added to the original uninfected p53-null line in a ratio of 15 GFP+/85% GFP− cells. Aliquots from three independent cultures were analyzed for GFP+ cells by FACS over 16 days. (e, bottom) The average percent of GFP+ cells is shown for each time point from three independent cultures. Error bars represent ±S.E. Immunoblot as in (d)

