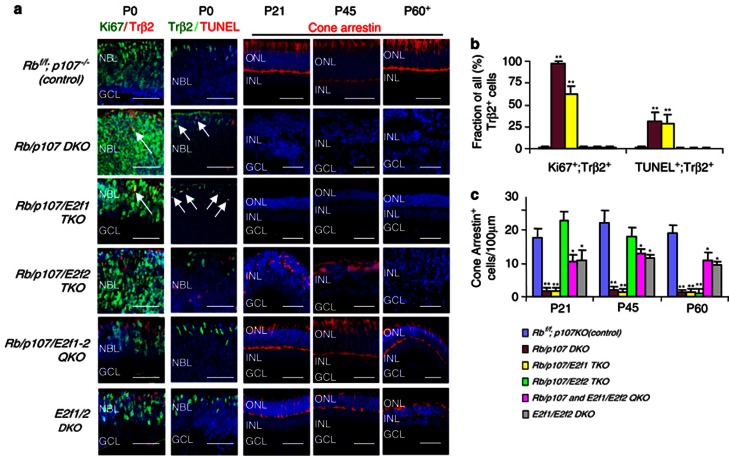
Figure 2.
Rb/p107 null cones are specified but divide and die. (a) Horizontal retinal sections of the indicated genotypes and ages were stained for nuclei (DAPI, blue), division (Ki67, green), new born cones (Trβ2, red or green as indicated), cell death (TUNEL, red) and mature cones (Cone-arrestin, red). Arrows indicate dividing or dying cones. ONL: outer nuclear layer. INL: inner nuclear layer. GCL: ganglion cell layer. NBL: neuroblastic layer. Scale bar is 50 μm. (b) The ratio of Ki67+;Trβ2+ or TUNEL+;Trβ2+ cells over all Trβ2+ cells of the indicated genotypes at P0. (c) The average number of Cone-arrestin+cells per 100 μm of the indicated genotypes and ages. Error bars represent S.D. and asterisks indicate significant difference between control (Rbf/f;p107−/−) and other retinas (*P<0.05, **P<0.01. Analysis of variance (ANOVA) and Tukey honestly significant difference (HSD) test)

