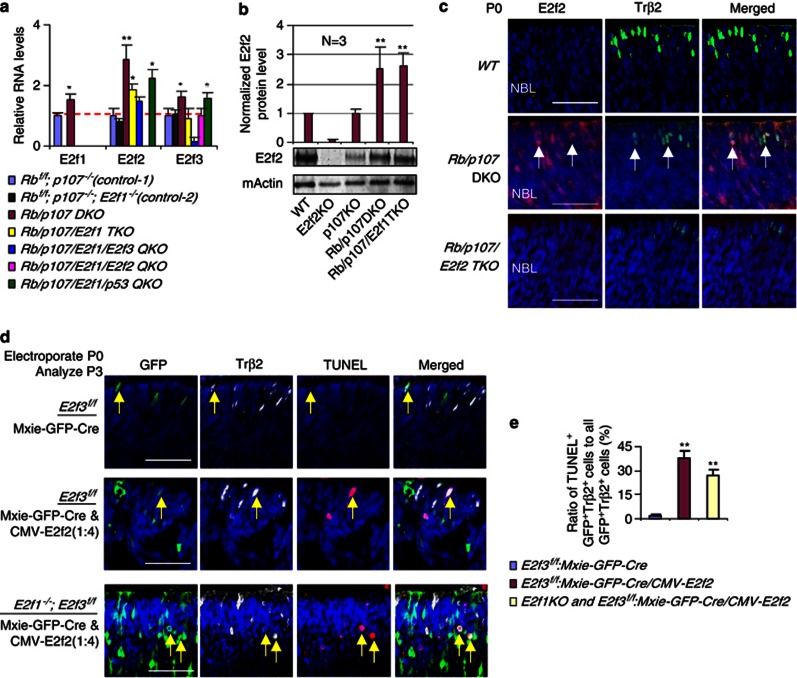
Figure 3.
E2f2 induces cone death independent of E2f1 and E2f3. (a) E2f1-independent E2f2 induction in the Rb/p107 null retina. RT-qPCR was used to measure the relative levels of E2f1-3 mRNAs in P0 retinas of the indicated genotypes. (b) Elevated E2f2 protein in the Rb/p107 and Rb/p107/E2f1 null retina. Graph shows normalized E2f2 protein levels at P0 in the indicated genotypes, and a representative western is shown below (n=3). (c) E2f2 is expressed in emerging cones. Horizontal P0 retinal sections of the indicated genotypes were stained for nuclei (DAPI, blue), E2f2 (red), cone precursors (Trβ2, green). Arrows indicate examples of double-labeled E2f2+; Trβ2+ cells. Scale bar is 50 μm. (d) Ectopic E2f2-induces death in E2f3 or E2f1/3 null cones. P0 retinas of the indicated genotypes were electroporated with Mxie-GFP-Cre/CMV-E2f2 plasmids (1 : 4) or Mxie-GFP-Cre alone. At P3, horizontal retinal sections were stained for nuclei (DAPI, blue), differentiating cones (Trβ2, white), cell death (TUNEL, red), and transfected cells (GFP, green). (e) The ratio of TUNEL+;GFP+;Trβ2+ cells (dying transfected cones) to all GFP+;Trβ2+ cells (transfected cones) in (d). Error bars represent S.D. and asterisks indicate significant difference from control (Rbf/f, p107−/− in (a), WT in (b)) and E2f3f/f cells transfected with Mxie-GFP-Cre in (e) (*P<0.05, **P<0.01. Analysis of variance (ANOVA) and Tukey honestly significant difference (HSD) test)

