Figure 4.
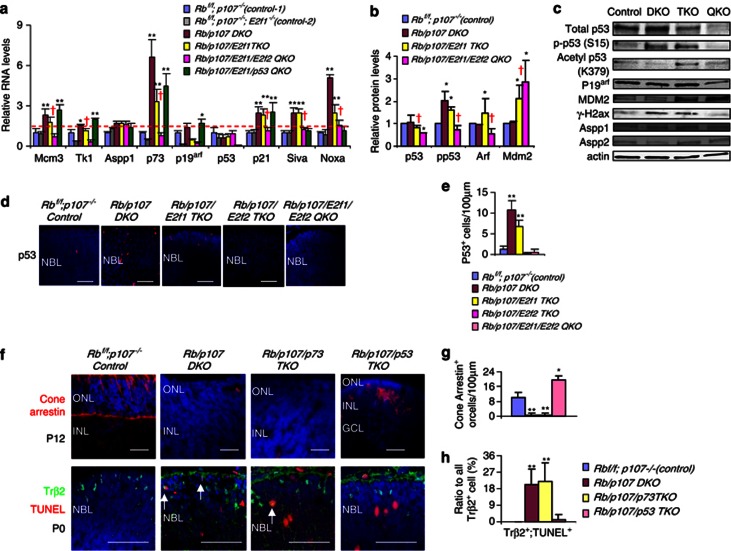
Cone death is p53-dependent. (a) Relative expression of indicated genes in P0 retina of the indicated genotypes, measured by RT-qPCR. The dashed line indicates the level of controls. (b) Relative protein level of indicated proteins in the P0 retina of the indicated genotypes, normalized to actin. Representative westerns are shown in C (n=3). (c) Western of indicated proteins in indicated retinas. Control: Rbf/f;p107−/−. DKO: Rb/p107 DKO. TKO: Rb/p107/E2f1 TKO. QKO: Rb/p107/E2f1/E2f2 QKO. (d) P0 retinas of the indicated genotypes were stained for nuclei (DAPI, blue) and p53 (red). (e) The absolute numbers per 100 μm unit of p53+ cells in indicated P0 retinas. (f) Retinal sections of the indicated ages and genotypes were stained for nuclei (DAPI, blue), Cone-arrestin (red), Trβ2 (green) and cell death (TUNEL, red). (g) The absolute number of Cone-arrestin+ cells per 100 μm of the indicated genotypes in f. (h) The ratio of Trβ2+/TUNEL+ cells over all Trβ2+ cells in f. In d and f, NBL: neuroblast layer. ONL: outer nuclear layer. INL: inner nuclear layer. GCL: ganglion cell layer. Scale bar is 50 μm. In a, b, e, g and h, error bars represent S.D., and asterisks indicate significant difference between control (Rbf/f;p107−/−) and other genotypes (*P<0.05, **P<0.01. Analysis of variance (ANOVA) and Tukey honestly significant difference (HSD test). Red cross indicates significant difference between Rb/p107/E2f1 TKO (yellow bar) and Rb/p107/E2f1/E2f2 QKO (pink bar) (P<0.05, Student's t-test)

