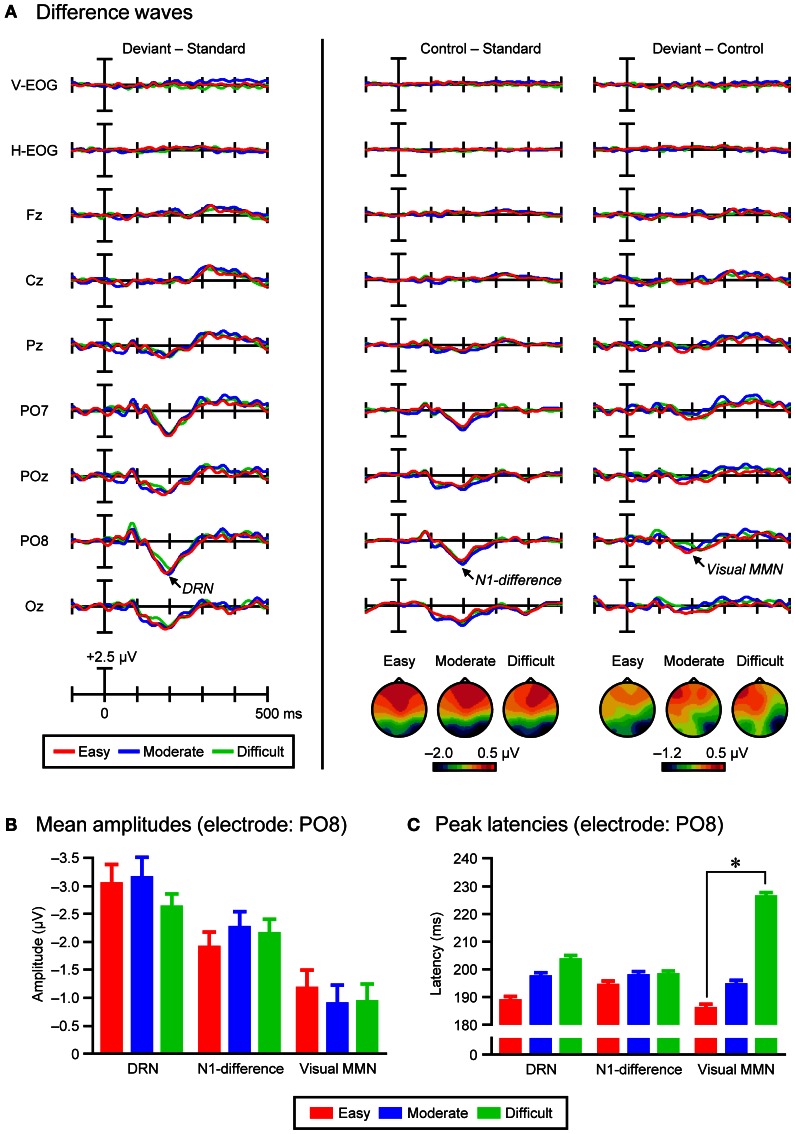
Figure 4.
(A) Grand-average deviant-minus-standard difference waves (left column), grand-average control-minus-standard difference waves and topographical maps of N1-difference (middle column), and grand-average deviant-minus-control difference waves and topographical maps of visual MMN (right column), in the three task-difficulty conditions (easy, moderate, and difficult). (B) Grand-average mean amplitudes of DRN, N1-difference, and visual MMN in the three task-difficulty conditions (electrode: PO8). Error bars indicate standard errors of the mean. (C) Grand-average peak latencies of DRN, N1-difference, and visual MMN in the three task-difficulty conditions (electrode: PO8). Error bars indicate standard errors of the mean with a jackknife method. Asterisks indicate a significant difference (p < 0.01).

