
Figure 1.
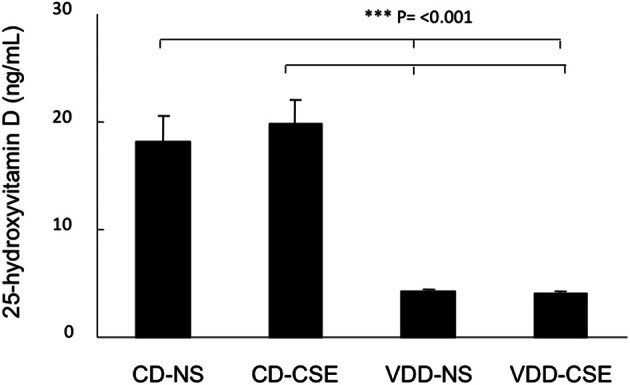
25-hydroxyvitamin D levels in the four treatment groups at the end of the experimental period. Values shown reflect means ± SEM of 19–23 mice per group. Levels of 25-hydroxyvitamin D in mice fed control diets were significantly different than mice fed a vitamin D deficient diet (p = 0.001).