
Figure 4.
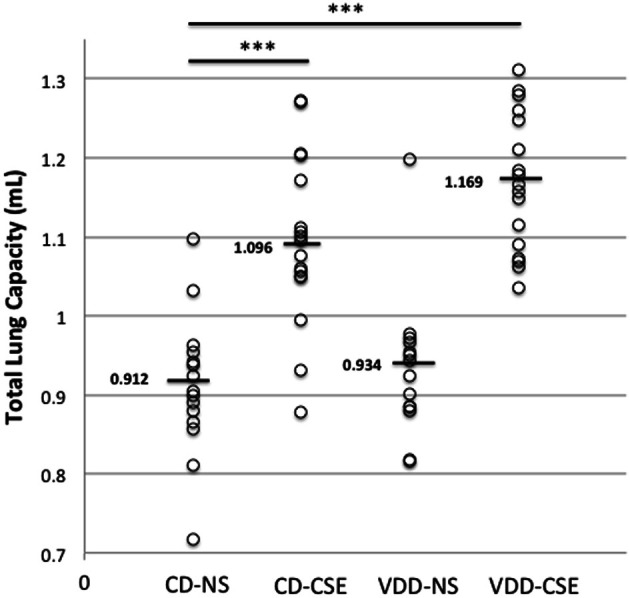
Total lung capacity (TLC) in experimental groups. Over the course of three separate experiments, total lung capacity was determined by flexiVent™ in 63 mice. Each point represents the data from one mouse with 14 to 17 mice per treatment group. Horizontal bars mark medians. A Two-Way ANOVA indicated that the mean TLC in the VDD-NS group and the CD-CSE group was significantly greater than the mean TLC in the control group (CD-NS) (indicated by *** in the figure; p = 0.001).