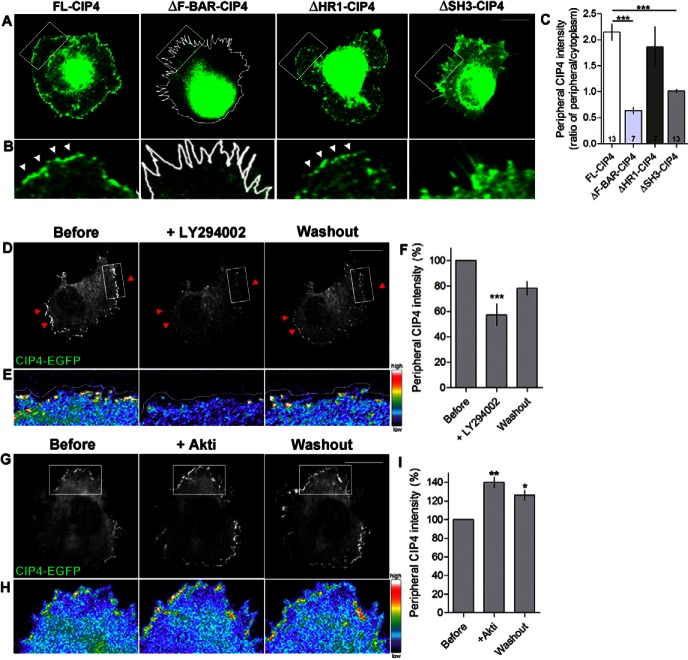
Fig. 1.
Domains of CIP4 and lipids required for CIP4 localization at the edge of protruding membranes in cortical neurons. (A) Images of stage 1 cortical neurons transfected with full-length myc-CIP4, myc-ΔF-BAR-CIP4, myc-ΔHR1-CIP4 or myc-ΔSH3-CIP4 and labeled with an antibody to myc. (B) Images magnified from boxes in A. White arrowheads indicate CIP4 at the peripheral membrane. (C) Bar graphs of the average intensity ratio of CIP4, ΔF-BAR-CIP4, ΔHR1-CIP4 and ΔSH3-CIP4 at the peripheral/central region of the neurons. Numbers in the bar graphs indicate number of cells quantified from at least two independent experiments. (D,G) Images of stage 1 cortical neurons transfected with CIP4-EGFP before, during and after LY294002 (10 µM) (D) or Akti (5 µM) (G) treatments. (E,H) Images magnified from boxes in D and G showing the intensity of CIP4 at the peripheral area in pseudocolor. White lines in A, B and E indicate the edge of the neurons. (F,I) Bar graphs of the average intensity of CIP4 at the peripheral membrane in CIP4-transfected neurons before treatment, after 20 minutes of LY294002 treatment (F) or 10 minutes in Akti (I), and after washout. Data are expressed as mean ± s.e.m. *P<0.05 **P<0.01 and ***P<0.001 compared with before treatment (one-way ANOVA with Dunnett's post-test comparison); n = 6 and 3 cells for LY and Akti, respectively, from three independent preparations. Scale bars: 10 µm.

