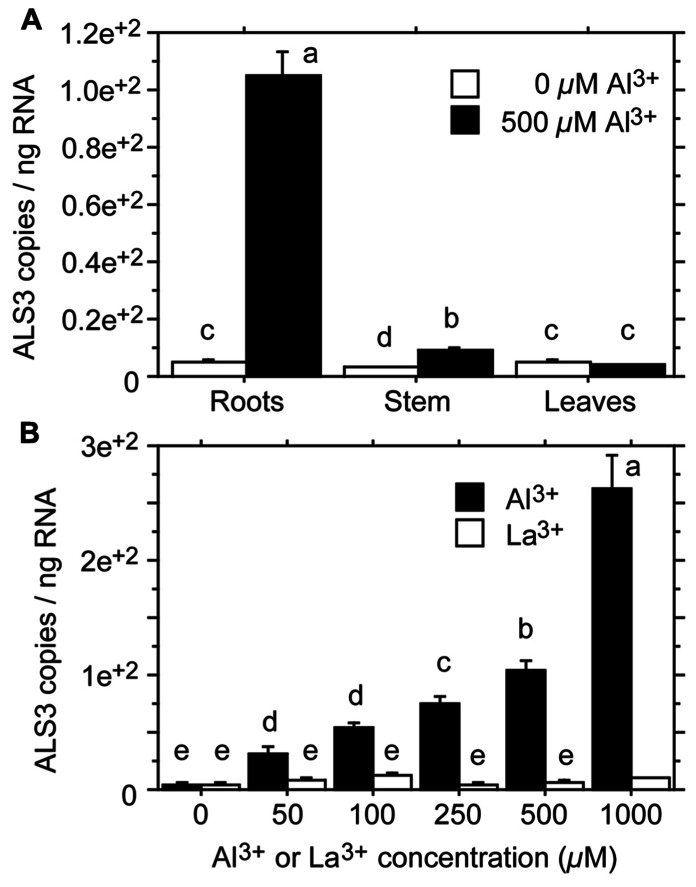
FIGURE 3.
Expression levels of ALS3 in tissues of Populus tremula treated with Al3+ for 2 days. (A) Expression levels in root, stem and leaf tissue after treatment with 0 or 500 μM Al3+. (B) Expression levels in the root tissue after treatment with 0, 50, 100, 250, 500, or 1000 μM Al3+ or La3+. Transcript levels were quantified by absolute qRT-PCR. Different letters indicate significant differences between treatments and elements: ANOVA; P < 0.05 (redrawn from Grisel et al., 2010).

