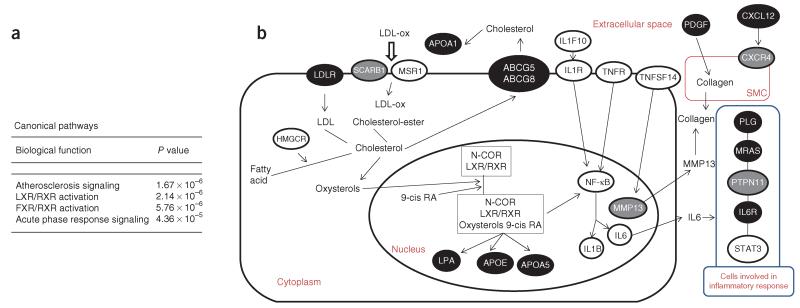
Figure 1.
Canonical pathway analysis. (a) The four most significant canonical pathways represented in networks 3, 5 and 9, and overlapping networks ON1 (includes networks 1, 2, 6 and 8) and ON2 (includes networks 4 and 7); all molecules are listed by network in supplementary table 10. (b) Schematic showing parts of the atherosclerosis signaling, LXR/RXR activation and acute phase response signaling canonical pathways (Ingenuity) that are involved in both lipid metabolism and inflammation. Genes in confirmed CAD susceptibility loci (including both previously and newly reported) and in loci showing suggestive association with an FDR of <10% are depicted as black and gray ovals, respectively. Other key genes are depicted as white ovals; notably, some of them, such as IL1F10-IL1B, STAT3 and HMGCR, have SNPs ranking in the top 1,000 in the FDR analysis. The process leading to myocardial infarction involves multiple cell types that are depicted in this schematic as a composite cell (large oval) and its nucleus (inner oval) in the extracellular space; the smooth muscle cell is shown separately (SMC; red oval), whereas the blue oval depicts cell types involved in the inflammatory response.

