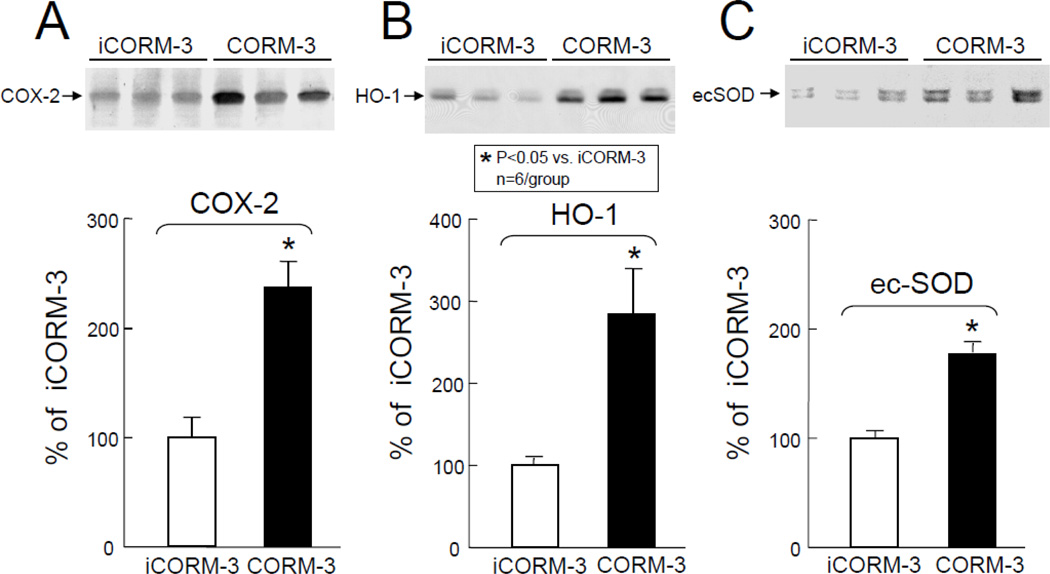
Figure 3.
Effects of inactive CORM-3 (iCORM-3, group V) and CORM-3 (group VI) administration on myocardial levels of COX-2, HO-1, and Ec-SOD 24 h later. Upper panels: Representative Western immunoblots showing increased expression of COX-2 (A), HO-1 (B), and Ec-SOD (C) in the hearts of CORM-3-treated mice compared with iCORM-3-treated mice. Lower panels: Densitometric analysis of COX-2, HO-1, and Ec-SOD signals. Data are means±SEM. *P<0.05 vs. iCORM-3.

