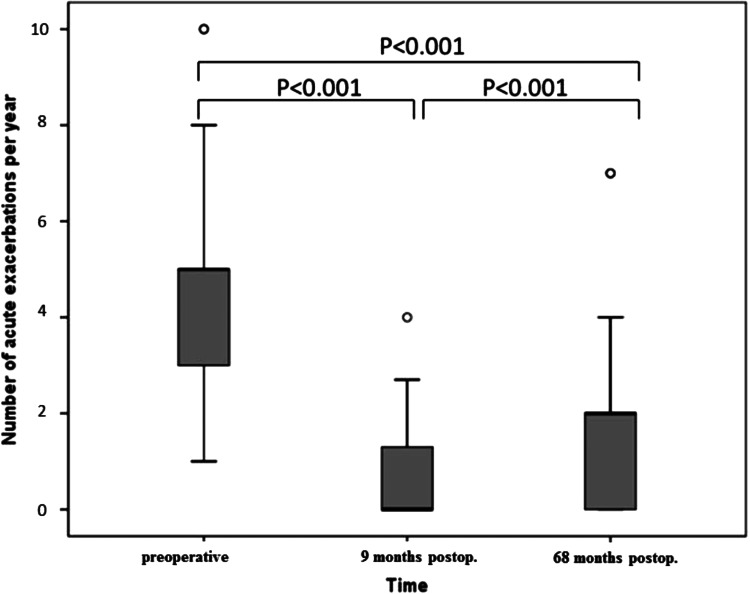
Figure 2.
The patient-reported number of acute exacerbations, e.g., prescribed antibiotic courses for doctor-diagnosed sinusitis, per year. At 9 months postoperatively the patients reported the number of antibiotics prescribed during the postoperative follow-up time period (9 months). Thus, this value was multiplied by 12/9 = 1.33 for the analysis and the presentation in the figure. The P values by Wilcoxon test. Horizontal lines represent medians; upper and lower vertical bars represent the 75th and 25th percentile ranges; vertical lines represent the 99th percentile range.

