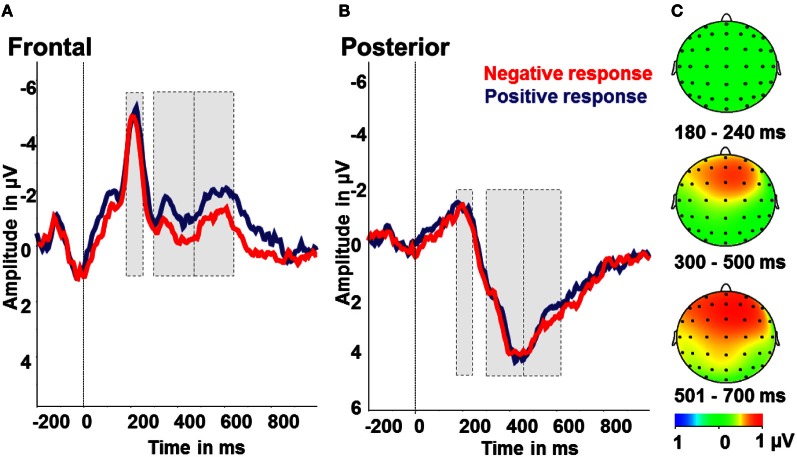
Figure 5.
Interpretation bias effect: ERP amplitudes for positive (blue) and negative responses (red) to the intermediate tones. (A) Frontal region of interest. (B) Posterior region of interest. (C) Activity difference of ambiguous tones and positive responses minus ambiguous tones and negative responses in μV in the time windows 180–240 ms (N2), 300–500 ms (early LPP) and 501–700 ms (late LPP) post-stimulus onset.

