
Figure 3.
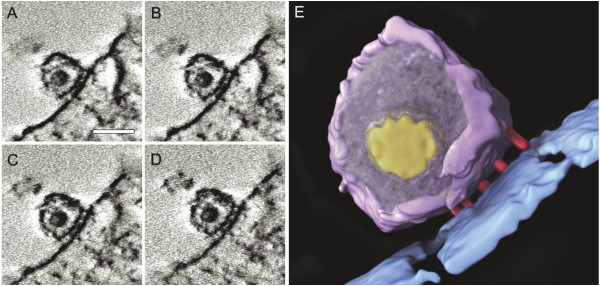
Imaging of HIV-1 in contact with T cells. (A-D) Four slices at different depths in a tomogram of the contact between HIV and T cells. (E) 3-D tomographically derived architecture of the contact region. Scale bar in (A) is 100 nm. Reproduced with permission from reference [53].