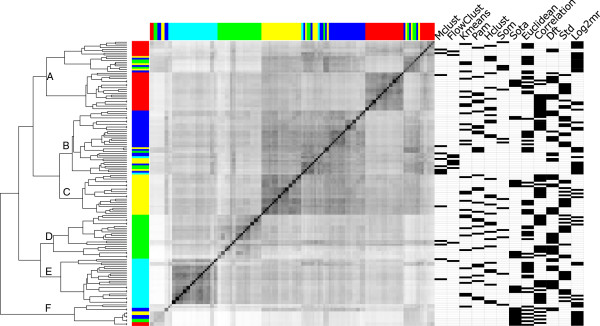
Figure 3.

Clustering results are determined by the normalization. Pairwise similarity between all clusterings with eight clusters, similarity is measured using mutual information. White encodes minimal similarity over gray to black for maximal similarity. Rows and columns of the symmetrical matrix are ordered identically according to hierarchical clustering (Hclust, complete link method) of the similarities, represented as dendrogram on the left. The normalization method applied to the data before clustering is color-coded: no normalization - blue, median polishing - yellow, LOS - green, cLOESS - cyan, quantile normalization - red. The remaining processing steps (clustering algorithm, similarity measure, transformation) are represented as black bars in the corresponding column on the right. The column “correlation” marks the usage of the Spearman correlation coefficient as similarity measure except for clusterings obtained from SOTA, which only allows usage of the Pearson correlation.
