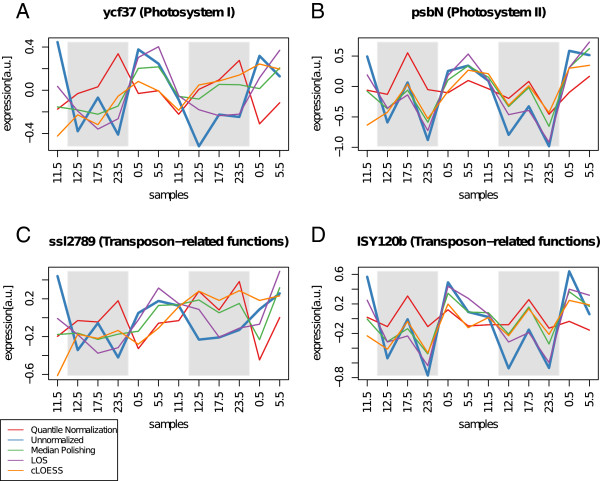
Figure 4.
Phase changes in high amplitude diurnal expression profiles due to normalization. The expression profiles of four genes with clear diurnal oscillations before and after normalization with several methods using 12 m transformed data. The expression profiles are shown in different colors as provided in the legend. The gray shaded area marks the subjective night. The genes ycf37 (A) and psbN (B) are functionally associated with the photosynthesis and exhibit induced expression over the day. The expression phase ϕ after quantile normalization is shifted by ≈130°. The genes ssl2789 (C) and ISY120b (D) have transposon-related functions and are phase shifted by ≈160° after quantile normalization.

