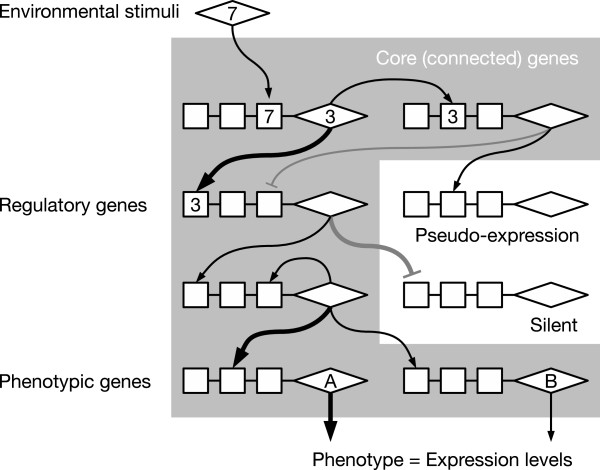
Figure 1.
A schematic example of a gene regulatory network model. The squares and diamonds represent cis- and trans-elements, respectively. For simplicity of explanation, only a few of the numbers used for mutual recognition between these elements are shown; however, each element had a number. Black arrow-headed lines and gray bar-headed lines represent transcriptional activation and repression, respectively, and the line weight denotes the intensity of the interaction. Note that different genes would be core genes in different environments.

