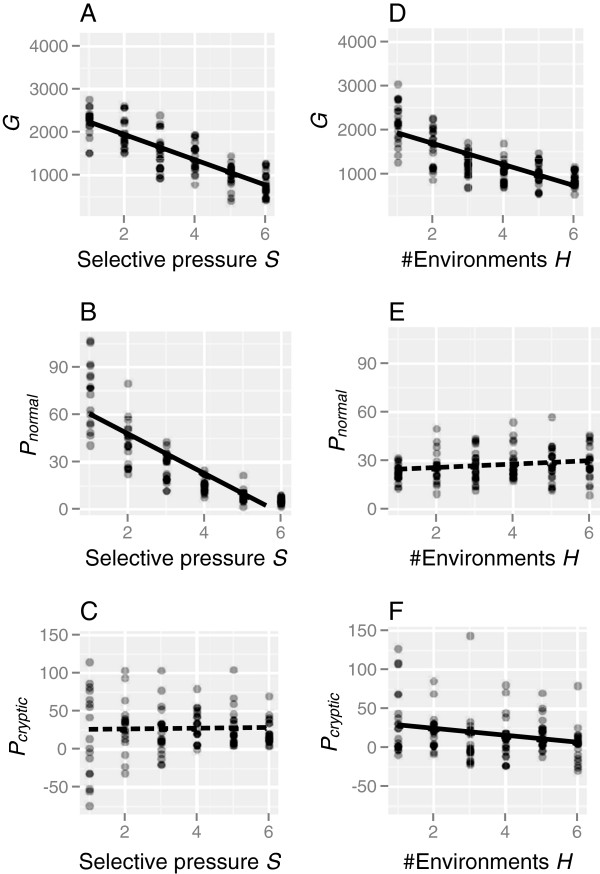
Figure 6.
Relationships between variations in a population and environmental parameters. Simulations were repeated 20 times for each parameter value, and each dot represents a simulation run. Regression lines were drawn on the basis of the linear regression statistics shown in Table 2; solid and dashed lines denote significant and non-significant correlations, respectively.

