
Figure 2.
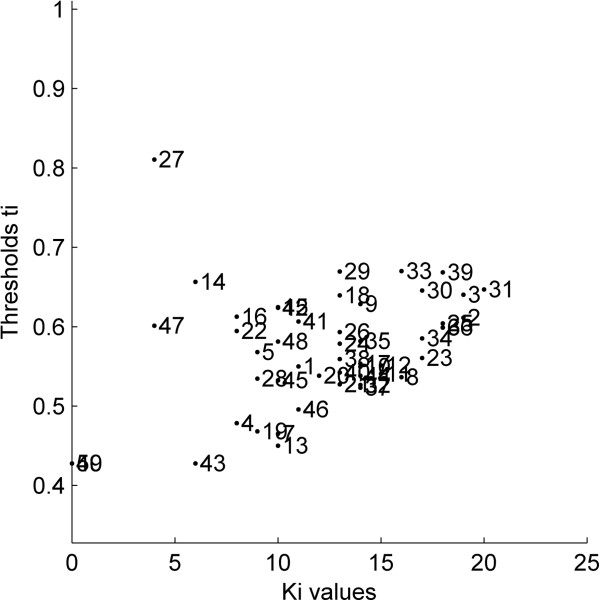
Simulated data set. Thresholds ti vs. number of training neighbours Ki plot (k = 12).
Official websites use .gov
A
.gov website belongs to an official
government organization in the United States.
Secure .gov websites use HTTPS
A lock (
) or https:// means you've safely
connected to the .gov website. Share sensitive
information only on official, secure websites.
Simulated data set. Thresholds ti vs. number of training neighbours Ki plot (k = 12).