
Figure 3.
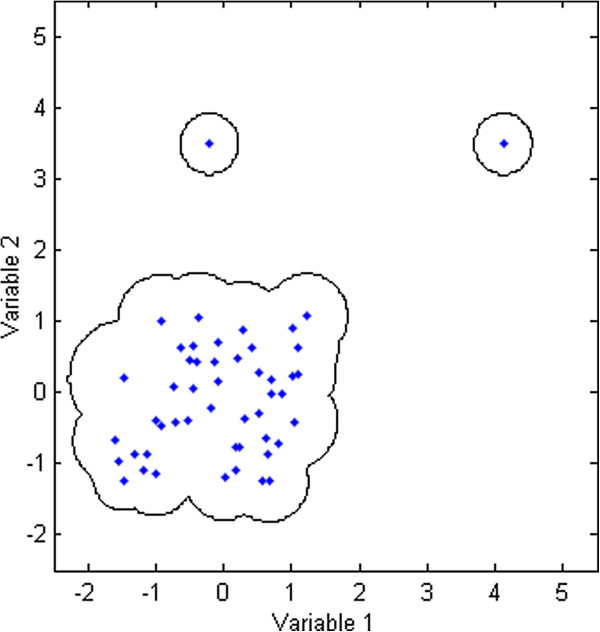
Simulated data set. Contour plot to demonstrate how the AD was characterised. Metric used: Euclidean distance; k = 12.
Official websites use .gov
A
.gov website belongs to an official
government organization in the United States.
Secure .gov websites use HTTPS
A lock (
) or https:// means you've safely
connected to the .gov website. Share sensitive
information only on official, secure websites.
Simulated data set. Contour plot to demonstrate how the AD was characterised. Metric used: Euclidean distance; k = 12.