
Figure 5.
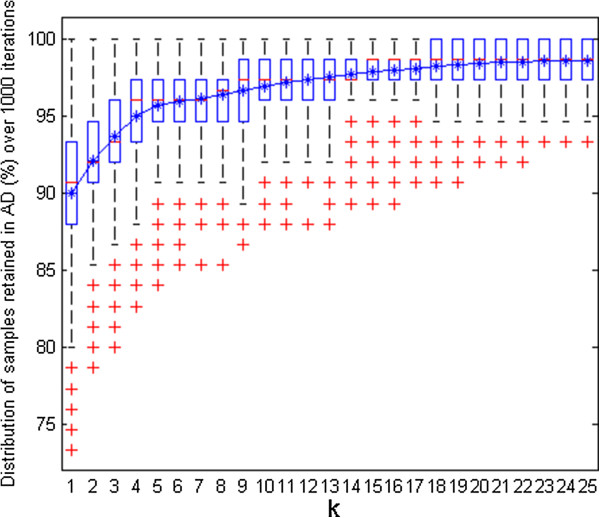
CAESAR BCF model. Box-and-whisker plot of test samples (%) retained within the AD for different k values during k-optimization.
Official websites use .gov
A
.gov website belongs to an official
government organization in the United States.
Secure .gov websites use HTTPS
A lock (
) or https:// means you've safely
connected to the .gov website. Share sensitive
information only on official, secure websites.
CAESAR BCF model. Box-and-whisker plot of test samples (%) retained within the AD for different k values during k-optimization.