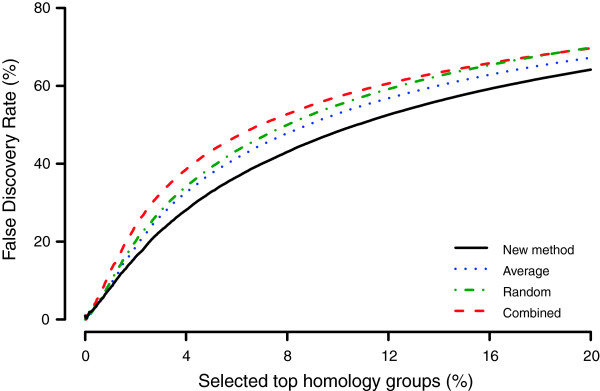
Figure 2.

Comparison of the false discovery rate. The false discovery rate (FDR) decrease when homology groups were ranked with the proposed method (solid black) compared to other methods (average - dotted blue, random - mixed green and combined - dashed red). The FDR was simulated for differentially expressed genes with a small effect (μ = 2, σ2 = 1). The x-axis shows percentage of selected genes and the y-axis the true false discovery rate. See Methods for full details about the simulation.
