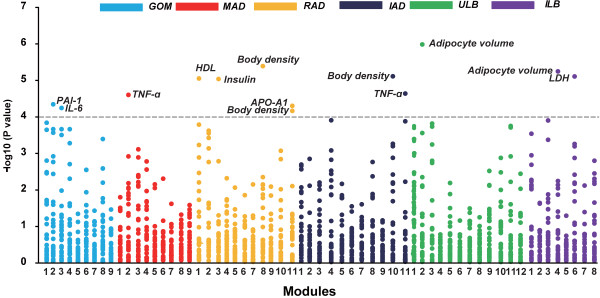
Figure 10.

Correlations between co-expressed gene modules in six adipose tissues and obesity phenotypic traits. -Log10 P values for Spearman rank correlation coefficients between the expressed values of the gene modules and the different obesity phenotypic traits are shown. The gray line represents the Bonferroni corrected P value greater than 0.05.
