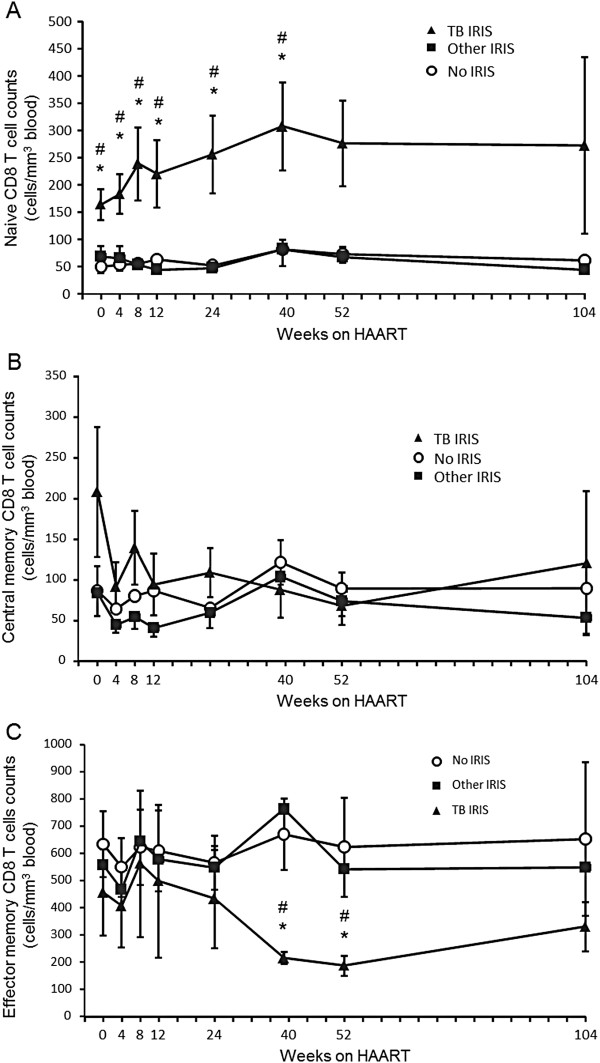
Figure 1.
Absolute counts of CD8 T cell subpopulations during antiretroviral treatment. Absolute counts of naive (A), central memory (B), and effector memory (C) CD8 T cells before (week 0) and during antiretroviral treatment in each patient group. Values correspond to mean count ± 1 SEM. * Significant difference between the TB IRIS and No IRIS groups. # Significant difference between the TB IRIS and Other IRIS groups. Two-group differences were determined only when the Kruskal-Wallis test showed overall group effects.

