
Figure 4.
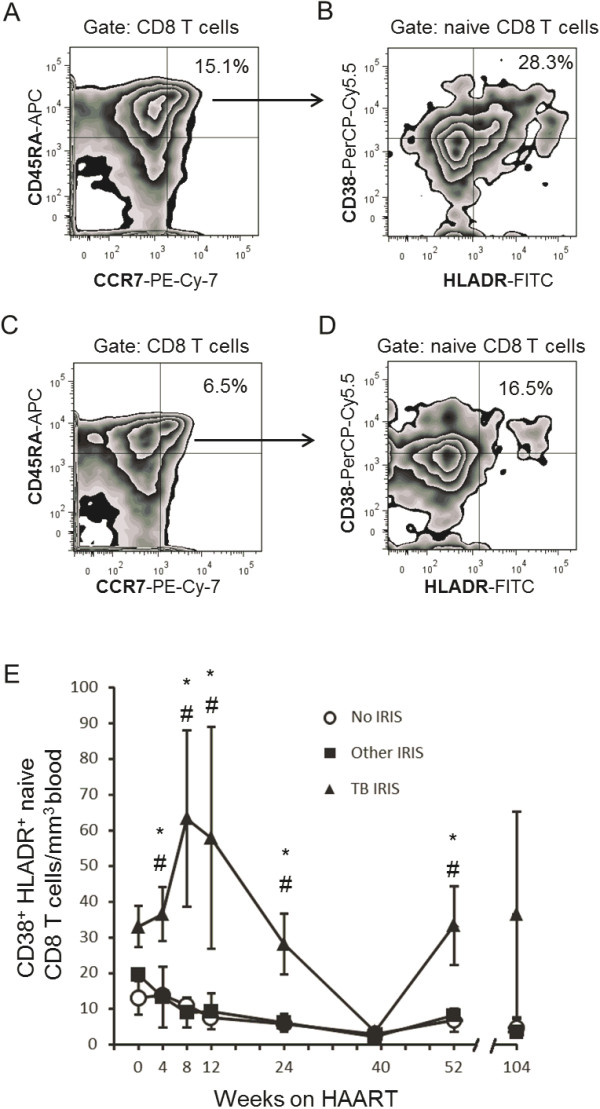
Expansion of activated naive CD8 T cells during TB IRIS. Zebra plots of CD8+ T cell maturation subpopulations according to CCR7 and CD45RA expression (see Methods) in a week 8 sample from a TB IRIS patient (A), and of week 8 sample from an Other IRIS patient who developed CMV retinitis at week 8 (C), showing the group’s mean % naive of CD8+ T cells. (B) Zebra plots showing activated subsets of naive CD8 T cells from the TB IRIS patient and the TB IRIS group’s mean % CD38+ HLADR+ of naive CD8 T cells at week 8. (D) Zebra plot showing activated subsets of naive CD8 T cells from the CMV IRIS patient and the Other IRIS group’s mean % CD38+ HLADR+ of naive CD8 T cells at week 8. (E) Absolute counts of CD38+ HLADR+ naive CD8+ T cells throughout the study. Values correspond to each group’s mean ± 1 SEM. * Significant difference between the TB IRIS and No IRIS groups # Significant difference between the TB IRIS and Other IRIS groups. Two-group differences were determined only when the Kruskal-Wallis test showed overall group effects.